

Question: please explain with excel 3. Using the data conduct the following: a. Starting with a forecast of 550 for quarter 1, forecast the demand for
please explain with excel 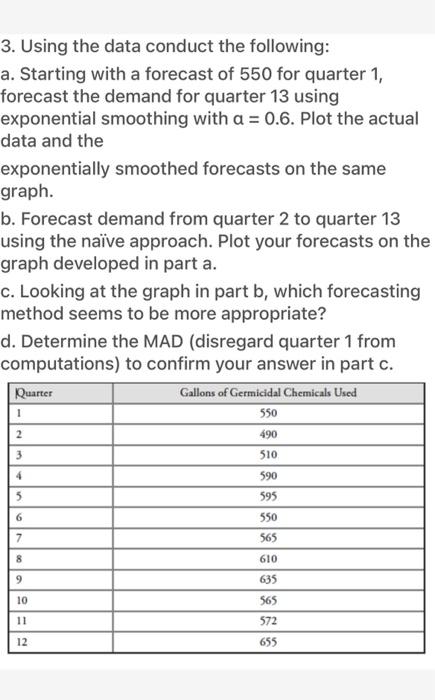
3. Using the data conduct the following: a. Starting with a forecast of 550 for quarter 1, forecast the demand for quarter 13 using exponential smoothing with a = 0.6. Plot the actual data and the exponentially smoothed forecasts on the same graph. b. Forecast demand from quarter 2 to quarter 13 using the nave approach. Plot your forecasts on the graph developed in part a. c. Looking at the graph in part b, which forecasting method seems to be more appropriate? d. Determine the MAD (disregard quarter 1 from computations) to confirm your answer in part c. Quarter Gallons of Germicidal Chemicals Used 550 1 490 3 510 4 590 595 6 550 7 565 8 610 9 635 10 565 11 572 12 655 Step by Step Solution
There are 3 Steps involved in it
1 Expert Approved Answer
Step: 1 Unlock

Question Has Been Solved by an Expert!
Get step-by-step solutions from verified subject matter experts
Step: 2 Unlock
Step: 3 Unlock