

Question: Please explain with solving mathematically linear equation and graph both Suppose you have been hired by a research firm trying to understand the market for
Please explain with solving mathematically linear equation and graph both
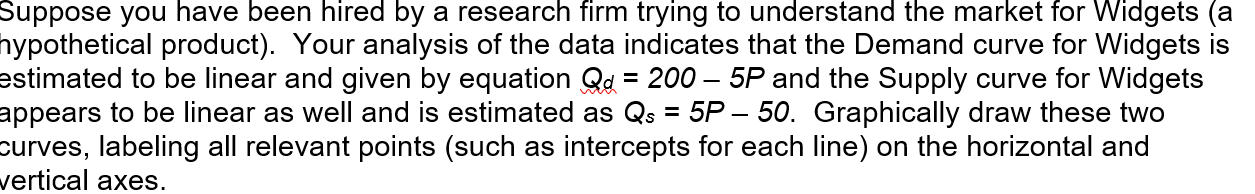
Suppose you have been hired by a research firm trying to understand the market for Widgets (a hypothetical product). Your analysis of the data indicates that the Demand curve for Widgets is estimated to be linear and given by equation Qd = 200 SP and the Supply curve for Widgets appears to be linear as well and is estimated as Q3 = 5P 50. Graphically draw these two curves, labeling all relevant points (such as intercepts for each line) on the horizontal and vertical axes
Step by Step Solution
There are 3 Steps involved in it
1 Expert Approved Answer
Step: 1 Unlock

Question Has Been Solved by an Expert!
Get step-by-step solutions from verified subject matter experts
Step: 2 Unlock
Step: 3 Unlock