

Question: PLEASE EXPLAIN WORK AND LABLE THE GRAPHS(Histogram ,Ogive) Complete the FREQUENCY DISTRIBUTION for the data provided then construct the (1) histogram and (2) ogive associated
PLEASE EXPLAIN WORK AND LABLE THE GRAPHS(Histogram ,Ogive)
Complete the FREQUENCY DISTRIBUTION for the data provided then construct the (1) histogram and (2) ogive associated with RESEARCHER A. (label your graphs and table accordingly)
Studies are often done by pharmaceutical companies to determine the effectiveness of a treatment program. Suppose that a new AIDS antibody drug is currently under study. It is given to patients once the AIDS symptoms have revealed themselves. Of interest is the average (mean) length of time in months patients live once starting the treatment. Two researchers each follow a different set of 40 AIDS patients from the start of treatment until their deaths. The following data (in months) are collected.
Researcher A:3; 4; 11; 15; 16; 17; 22; 44; 37; 16; 14; 24; 25; 15; 26; 27; 33; 29; 35; 44; 13; 21; 22; 10; 12; 8; 40; 32; 26; 27; 31; 34; 29; 17; 8; 24; 18; 47; 33; 34
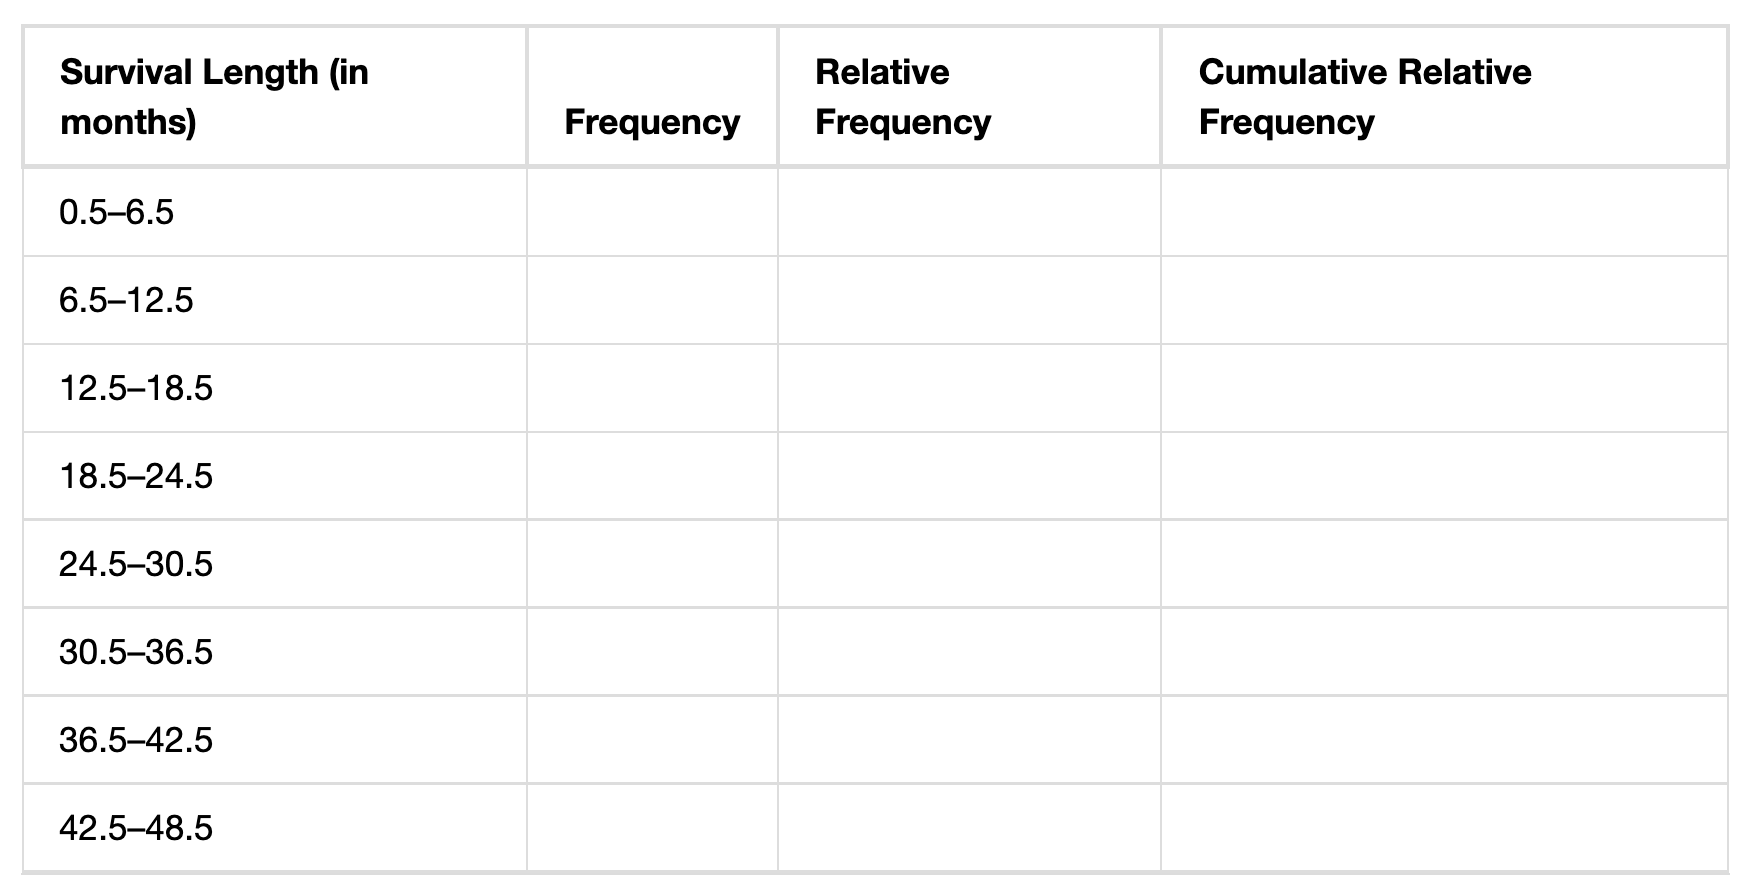
Survival Length (in Relative Cumulative Relative months) Frequency Frequency Frequency 0.5-6.5 6.5-12.5 12.5-18.5 18.5-24.5 24.5-30.5 30.5-36.5 36.5-42.5 42.5-48.5
Step by Step Solution
There are 3 Steps involved in it

Get step-by-step solutions from verified subject matter experts