

Question: Please explain you answers, thanks. The graph below {from @BadBBCGraphs) plots the number of football (soccer) matches the top 9 Premier League players appeared in
Please explain you answers, thanks.
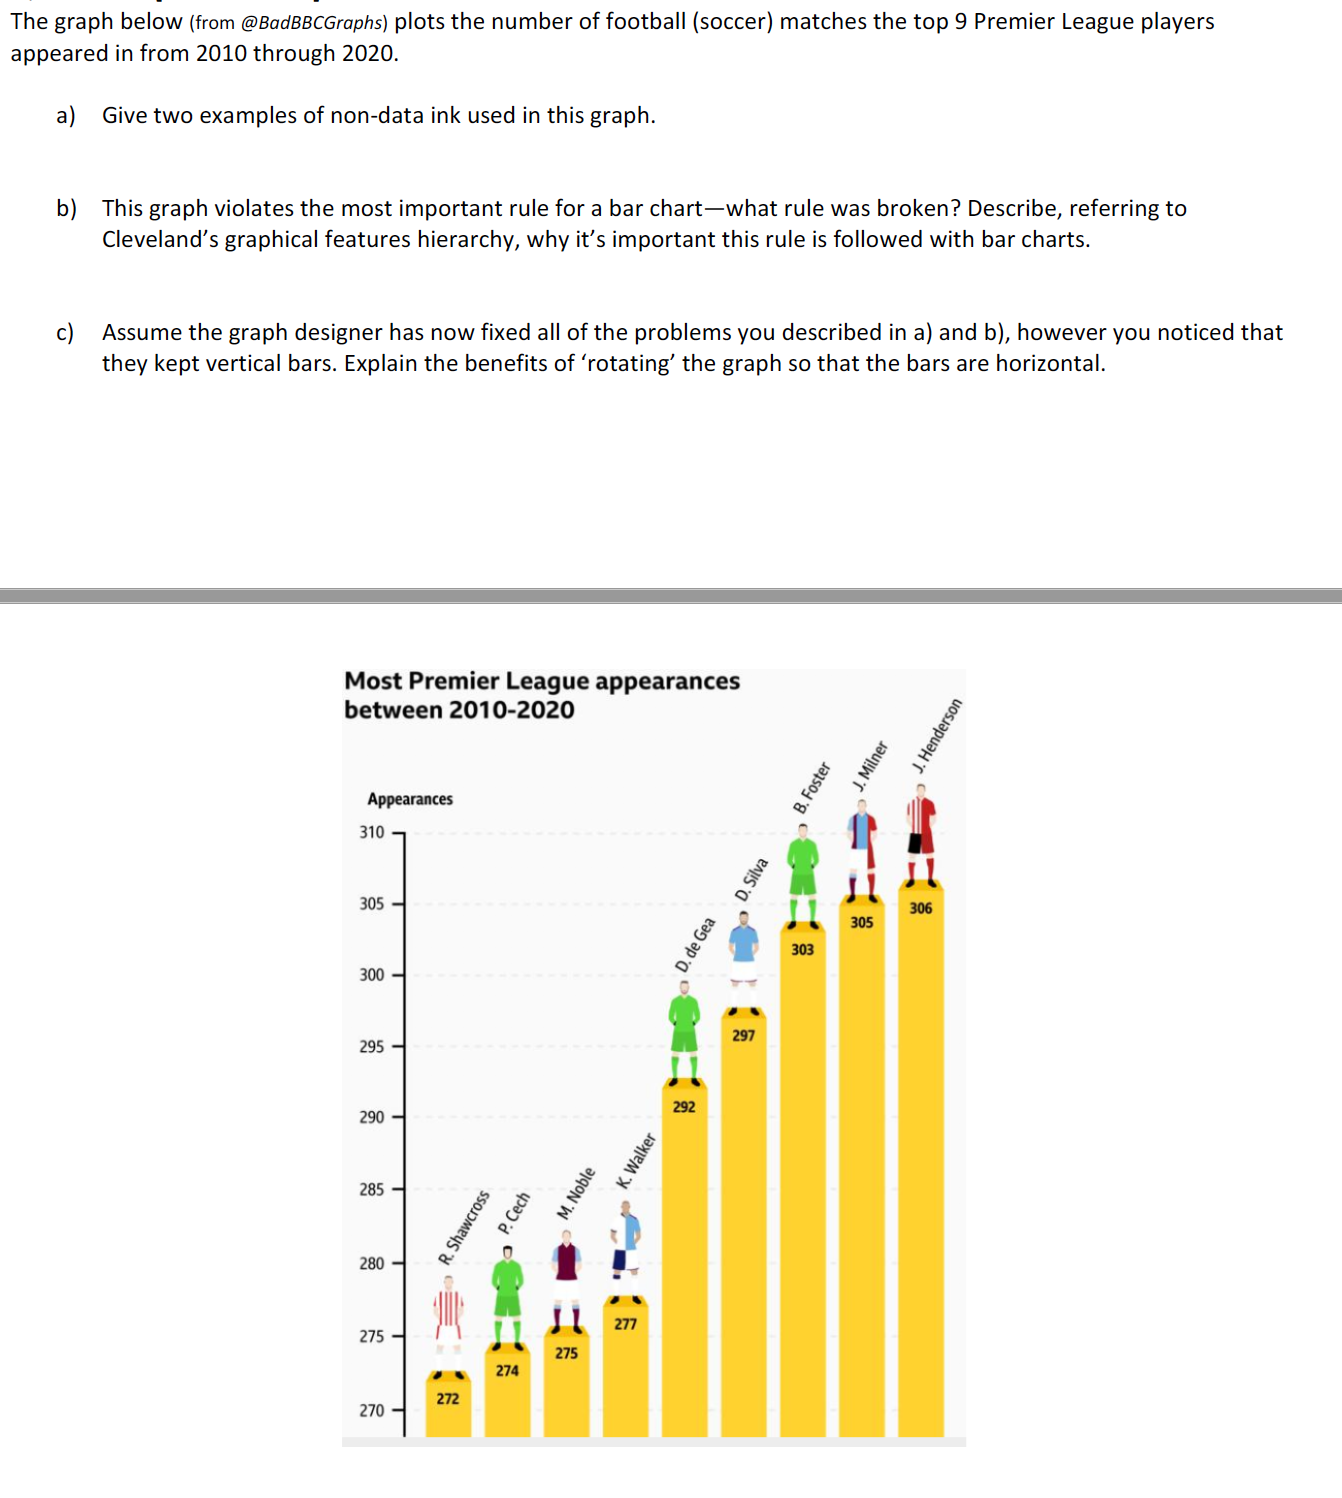
The graph below {from @BadBBCGraphs) plots the number of football (soccer) matches the top 9 Premier League players appeared in from 2010 through 2020. a) Give two examples of non-data ink used in this graph. b) This graph violates the most important rule for a bar chartwhat rule was broken? Describe, referring to Cleveland's graphical features hierarchy, why it's important this rule is followed with bar charts. c) Assume the graph designer has now fixed all of the problems you described in a) and b}, however you noticed that they kept vertical bars. Explain the benefits of 'rotating' the graph so that the bars are horizontal. Most Premier League appearances between 2010-2020 310 s?" a! Z s! as .. ~ ' ii! .lii II
Step by Step Solution
There are 3 Steps involved in it

Get step-by-step solutions from verified subject matter experts