

Question: Please explain your answer and why you think they are right. Thanks! Figure 8: 2000 [24] Figure 8 is the single component phase diagram for
Please explain your answer and why you think they are right. Thanks!
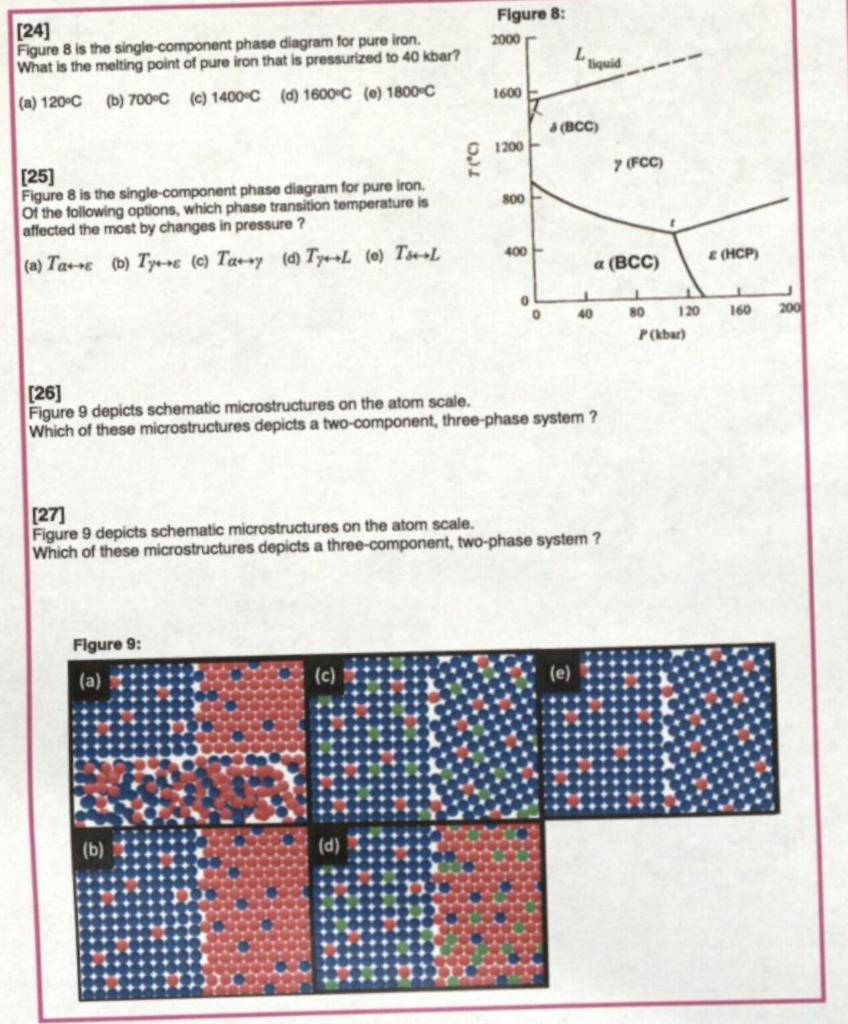
Figure 8: 2000 [24] Figure 8 is the single component phase diagram for pure iron. What is the melting point of pure iron that is pressurized to 40 kbar? L liquid 1600 (a) 120C (b) 700C (c) 1400C (d) 1600C (0) 1800C (BCC) 1200 TCC 7 (FCC) 800 [25] Figure 8 is the single-component phase diagram for pure iron. of the following options, which phase transition temperature is affected the most by changes in pressure ? (a) Ta* (b) Ty-- (c) T--- (a) Ty-L (@) Ts-L 400 (HCP) a (BCC) 0 0 40 160 200 80 120 P(bar) [26] Figure 9 depicts schematic microstructures on the atom scale. Which of these microstructures depicts a two-component, three-phase system? [27] Figure 9 depicts schematic microstructures on the atom scale. Which of these microstructures depicts a three-component, two-phase system? Figure 9: (a) (b)
Step by Step Solution
There are 3 Steps involved in it

Get step-by-step solutions from verified subject matter experts