

Question: Please explain your answers, thank you. Context for the Assignment All questions relate to the descriptive analysis of a dataset (see file on Brightspace-Ass.3- Excel
Please explain your answers, thank you.
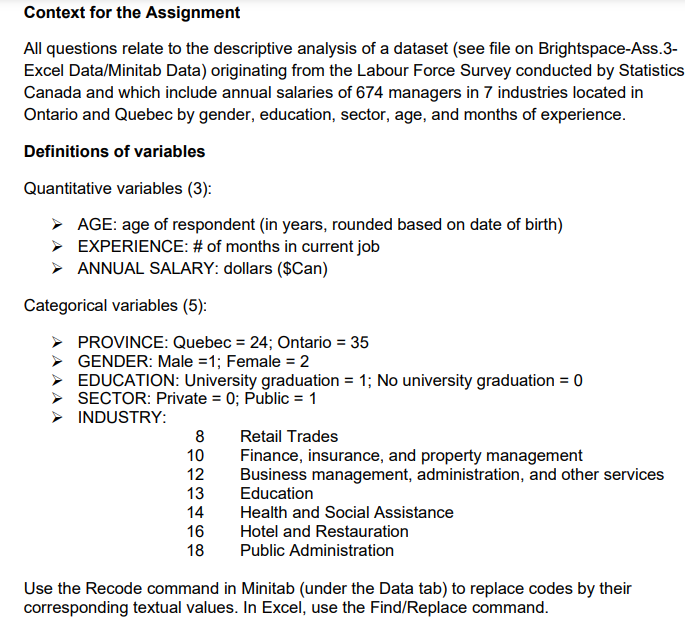
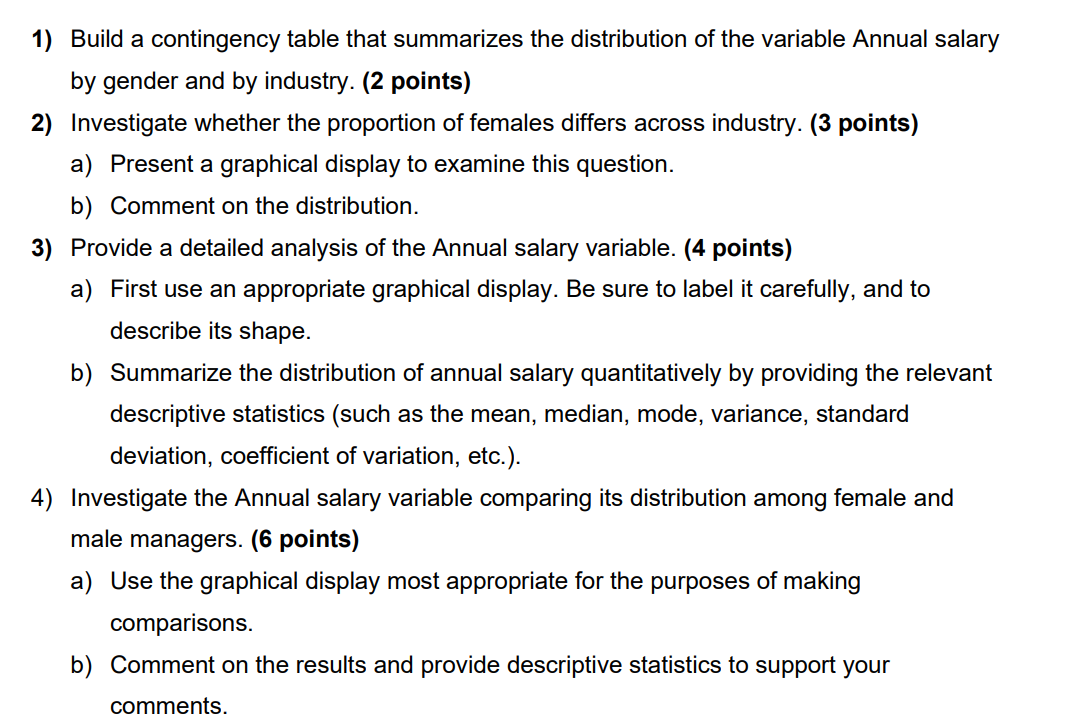
Context for the Assignment All questions relate to the descriptive analysis of a dataset (see file on Brightspace-Ass.3- Excel Data/Minitab Data) originating from the Labour Force Survey conducted by Statistics Canada and which include annual salaries of 674 managers in 7 industries located in Ontario and Quebec by gender, education, sector, age, and months of experience. Definitions of variables Quantitative variables (3): AGE: age of respondent (in years, rounded based on date of birth) > EXPERIENCE: # of months in current job ANNUAL SALARY: dollars ($Can) Categorical variables (5): PROVINCE: Quebec = 24; Ontario = 35 GENDER: Male =1; Female = 2 AAA EDUCATION: University graduation = 1; No university graduation = 0 SECTOR: Private = 0; Public = 1 INDUSTRY: 8 Retail Trades 10 Finance, insurance, and property management 12 Business management, administration, and other services 13 Education 14 Health and Social Assistance 16 Hotel and Restauration 18 Public Administration Use the Recode command in Minitab (under the Data tab) to replace codes by their corresponding textual values. In Excel, use the Find/Replace command.1) Build a contingency table that summarizes the distribution of the variable Annual salary by gender and by industry. (2 points) 2) Investigate whether the proportion of females differs across industry. (3 points) a) Present a graphical display to examine this question. b} Comment on the distribution. 3) Provide a detailed analysis of the Annual salary variable. (4 points) a) First use an appropriate graphical display. Be sure to label it carefully, and to describe its shape. b) Summarize the distribution of annual salary quantitatively by providing the relevant descriptive statistics (such as the mean, median, mode, variance, standard deviation, coefcient of variation, etc.). 4) Investigate the Annual salary variable comparing its distribution among female and male managers. (6 points) a) Use the graphical display most appropriate for the purposes of making comparisons. b) Comment on the results and provide descriptive statistics to support your comments
Step by Step Solution
There are 3 Steps involved in it

Get step-by-step solutions from verified subject matter experts