

Question: QUESTION 4 The table below shows historical return for the two types of security assets in 5 years period. These two assets are grouped
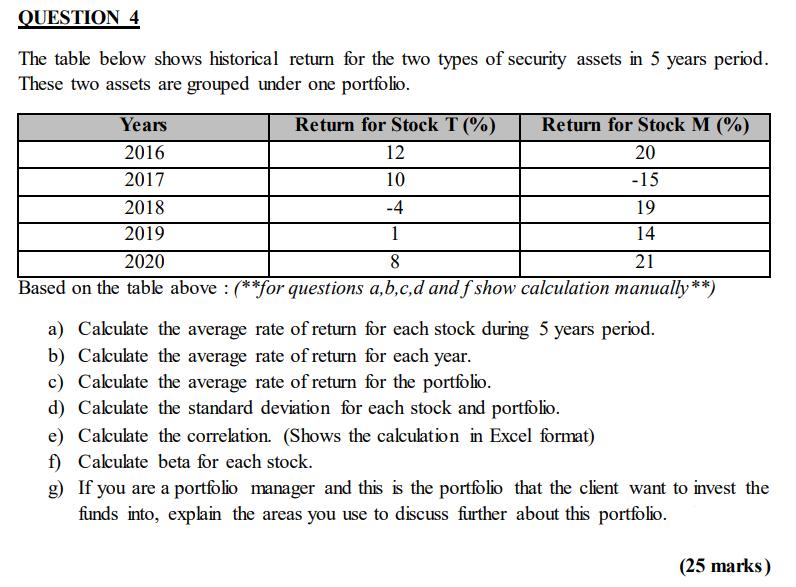
QUESTION 4 The table below shows historical return for the two types of security assets in 5 years period. These two assets are grouped under one portfolio. Years 2016 2017 Return for Stock T (%) 12 10 -4 1 2020 8 Based on the table above : (**for questions a,b,c,d and f show calculation manually**) Return for Stock M (%) 20 -15 2018 2019 19 14 21 a) Calculate the average rate of return for each stock during 5 years period. b) Calculate the average rate of return for each year. c) Calculate the average rate of return for the portfolio. d) Calculate the standard deviation for each stock and portfolio. e) Calculate the correlation. (Shows the calculation in Excel format) f) Calculate beta for each stock. g) If you are a portfolio manager and this is the portfolio that the client want to invest the funds into, explain the areas you use to discuss further about this portfolio. (25 marks)
Step by Step Solution
3.39 Rating (155 Votes )
There are 3 Steps involved in it
The detailed answer for the above question is provided below a Calculate the average rate of return for each stock during 5 years period Stock T Average rate of return for Stock T 12 10 4 1 8 5 112 St... View full answer

Get step-by-step solutions from verified subject matter experts