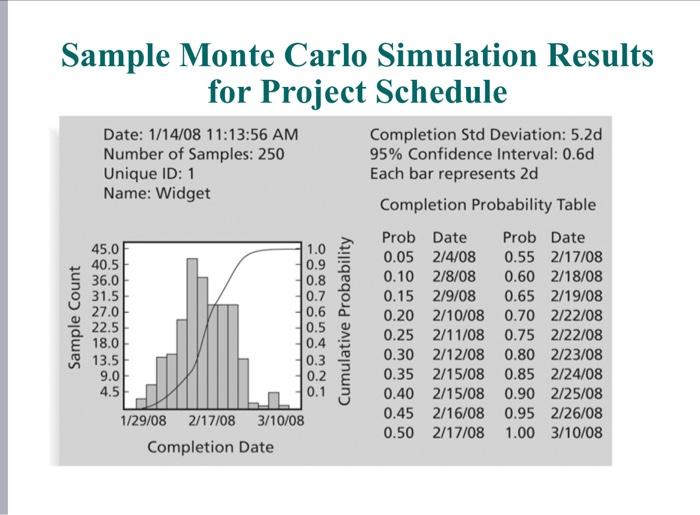
Question: please explaine to me the slide - risk management Sample Monte Carlo Simulation Results for Project Schedule Date: 1/14/08 11:13:56 AM Number of Samples: 250

please explaine to me the slide - risk management
Sample Monte Carlo Simulation Results for Project Schedule Date: 1/14/08 11:13:56 AM Number of Samples: 250 Unique ID: 1 Name: Widget Completion Std Deviation: 5.2d 95% Confidence Interval: 0.6d Each bar represents 2d Completion Probability Table Sample Count 45.0 40.5 36.0 31.5 27.0 22.5 18.0 13.5 9.0 4.5 1.0 0.9 0.8 0.7 0.6 0.5 0.4 0.3 0.2 0.1 Cumulative Probability Prob Date Prob Date 0.05 2/4/08 0.55 2/17/08 0.10 2/8/08 0.60 2/18/08 0.15 2/9/08 0.65 2/19/08 0.20 2/10/08 0.70 2/22/08 0.25 2/11/08 0.75 2/22/08 0.30 2/12/08 0.80 2/23/08 0.35 2/15/08 0.85 2/24/08 0.40 2/15/08 0.90 2/25/08 0.45 2/16/08 0.95 2/26/08 0.50 2/17/08 1.00 3/10/08 1/29/08 2/17/08 3/10/08 Completion Date

Step by Step Solution

There are 3 Steps involved in it

1 Expert Approved Answer
Step: 1 Unlock blur-text-image
Question Has Been Solved by an Expert!

Get step-by-step solutions from verified subject matter experts

Step: 2 Unlock
Step: 3 Unlock

Students Have Also Explored These Related General Management Questions!