

Question: Please fill in all the blank highlighted boxes (data in text format) Statement of Income and Retained Earnings For years ended Dec 31, 2018 and
Please fill in all the blank highlighted boxes
(data in text format)
Statement of Income and Retained Earnings For years ended Dec 31, 2018 and 2017 Horizonatal Analysis $ Change % Change 2018 Net Sales Cost of Goods Sold Gross Profit 19,800,000.00 9,000,000.00 10,800,000.00 2017 19,000,000.00 8,360,000.00 10,640,000.00 Operating Expenses Salaries and Wages Expense Depreciation Expense Other Operating Expenses 7,300,000.00 140,000.00 1,235,000.00 7,200,000.00 120,000.00 1,205,000.00 Total Operating Expenses 8,675,000.00 8,525,000.00 Operating Income 2,125,000.00 2,115,000.00 Other Income and Expenses Interest Expense Income Before Income Taxes 205,000.00 1,920,000.00 225,000.00 1,890,000.00 Income Taxes 400,000.00 400,000.00 Net Income 1,520,000.00 1,490,000.00 Beg Retained Earnings Net Income Dividends Paid Ending Retained Earnings 1,010,000.00 1,520,000.00 1,000,000.00 1,530,000.00 520,000.00 1,490,000.00 1,000,000.00 1,010,000.00 Vertical Analysis 8 Points Ratio Analysis Profit Margin Times Interest Earned 2018 Net Sales Cost of Goods Sold Gross Profit Liquidity Ratios Working capital Cu Current ratio 37% Operating Expenses Salaries and Wages Expense Depreciation Expense Other Operating Expenses Inventory turnover Days in inventory Total Operating Expenses Accounts receivable turnover AL Operating Income Average collection period Solvency Ratios Other Income and Expenses Interest Expense Income Before Income Taxes 1% Debt to assets ratio 1 Income Taxes Free cash flow In Net cash provided by operating activa Net Income 8%
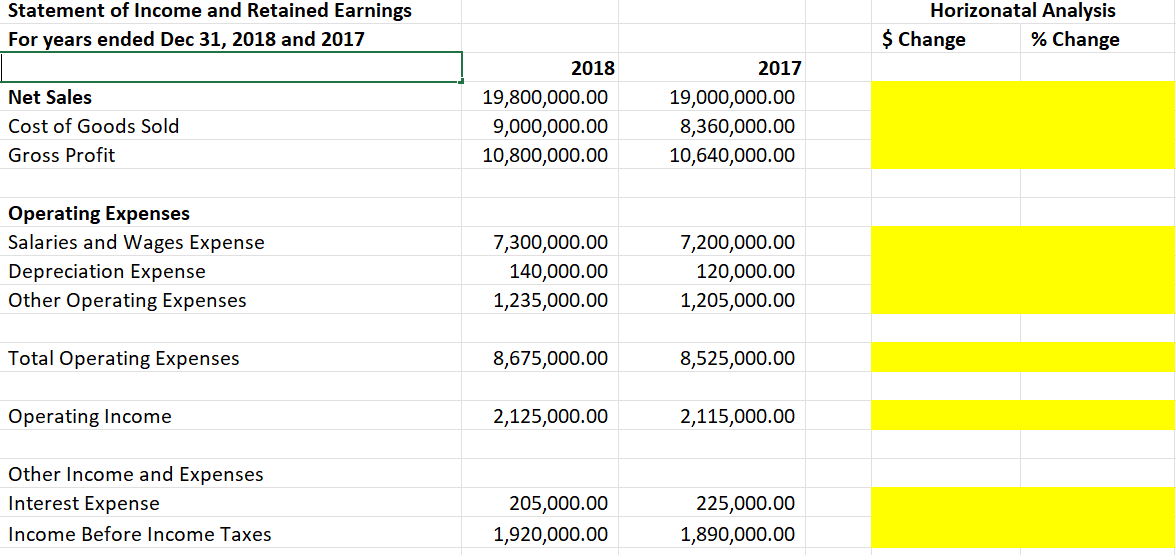
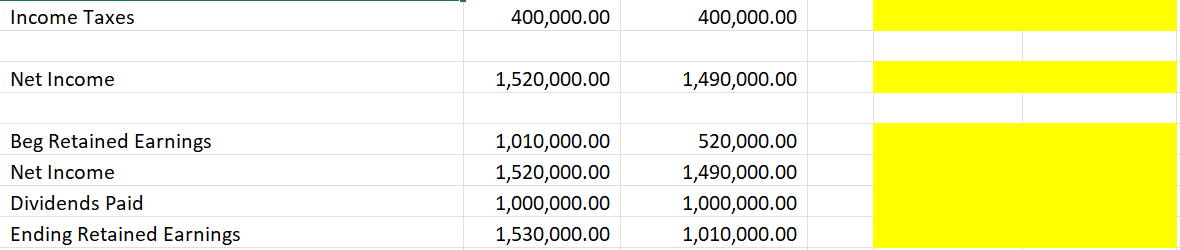
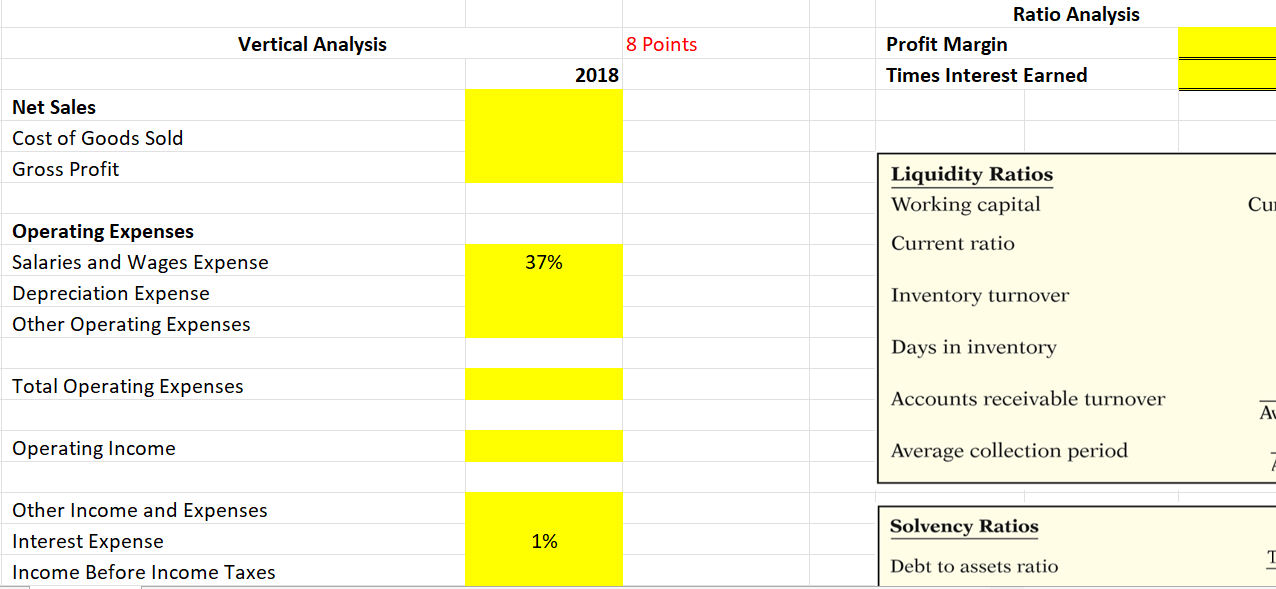

Statement of Income and Retained Earnings For years ended Dec 31, 2018 and 2017 Horizonatal Analysis $ Change % Change 2018 Net Sales Cost of Goods Sold Gross Profit 19,800,000.00 9,000,000.00 10,800,000.00 2017 19,000,000.00 8,360,000.00 10,640,000.00 Operating Expenses Salaries and Wages Expense Depreciation Expense Other Operating Expenses 7,300,000.00 140,000.00 1,235,000.00 7,200,000.00 120,000.00 1,205,000.00 Total Operating Expenses 8,675,000.00 8,525,000.00 Operating Income 2,125,000.00 2,115,000.00 Other Income and Expenses Interest Expense Income Before Income Taxes 205,000.00 1,920,000.00 225,000.00 1,890,000.00 Income Taxes 400,000.00 400,000.00 Net Income 1,520,000.00 1,490,000.00 Beg Retained Earnings Net Income Dividends Paid Ending Retained Earnings 1,010,000.00 1,520,000.00 1,000,000.00 1,530,000.00 520,000.00 1,490,000.00 1,000,000.00 1,010,000.00 Vertical Analysis 8 Points Ratio Analysis Profit Margin Times Interest Earned 2018 Net Sales Cost of Goods Sold Gross Profit Liquidity Ratios Working capital Cu Current ratio 37% Operating Expenses Salaries and Wages Expense Depreciation Expense Other Operating Expenses Inventory turnover Days in inventory Total Operating Expenses Accounts receivable turnover AL Operating Income Average collection period Solvency Ratios Other Income and Expenses Interest Expense Income Before Income Taxes 1% Debt to assets ratio 1 Income Taxes Free cash flow In Net cash provide by operating activa Net Income 8%
Step by Step Solution
There are 3 Steps involved in it

Get step-by-step solutions from verified subject matter experts