

Question: please fill in chart In this problem, you are to test the validity of your forecasting model. Here are the forecasts for a model you
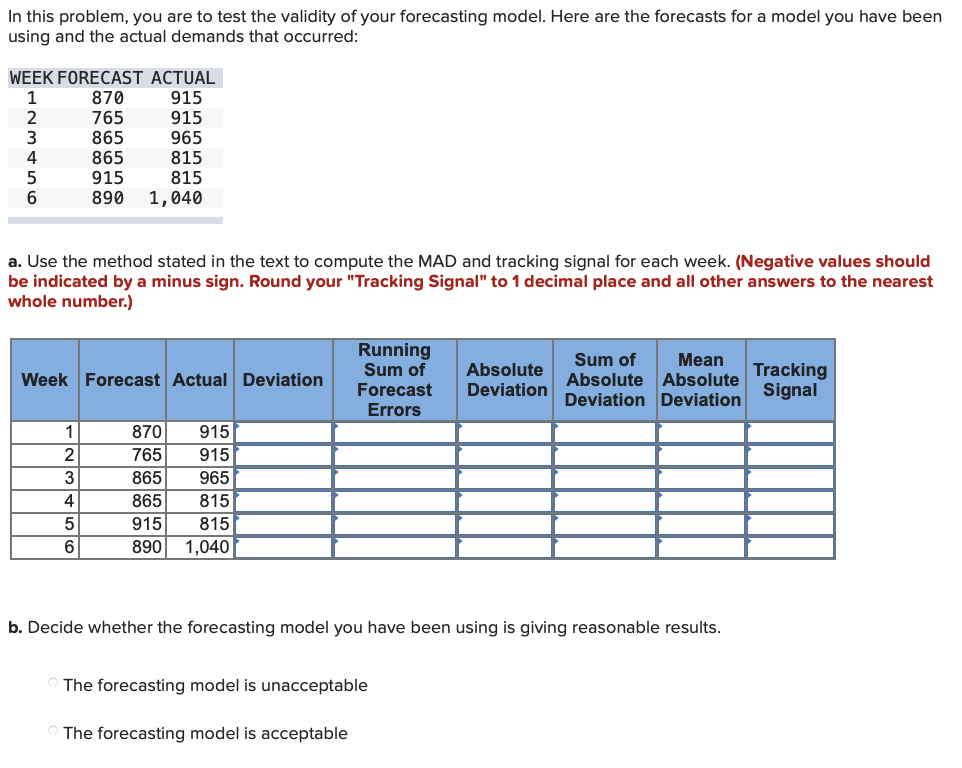 please fill in chart
Step by Step Solution
There are 3 Steps involved in it
1 Expert Approved Answer
Step: 1 Unlock

Question Has Been Solved by an Expert!
Get step-by-step solutions from verified subject matter experts
Step: 2 Unlock
Step: 3 Unlock