

Question: Please fill in orange chart it has the wrong answers in it thank you thank you thank you courses/186285/quizzes/1424356?module_ite lework 4: SHS 311: Hearing X
Please fill in orange chart it has the wrong answers in it thank you thank you thank you
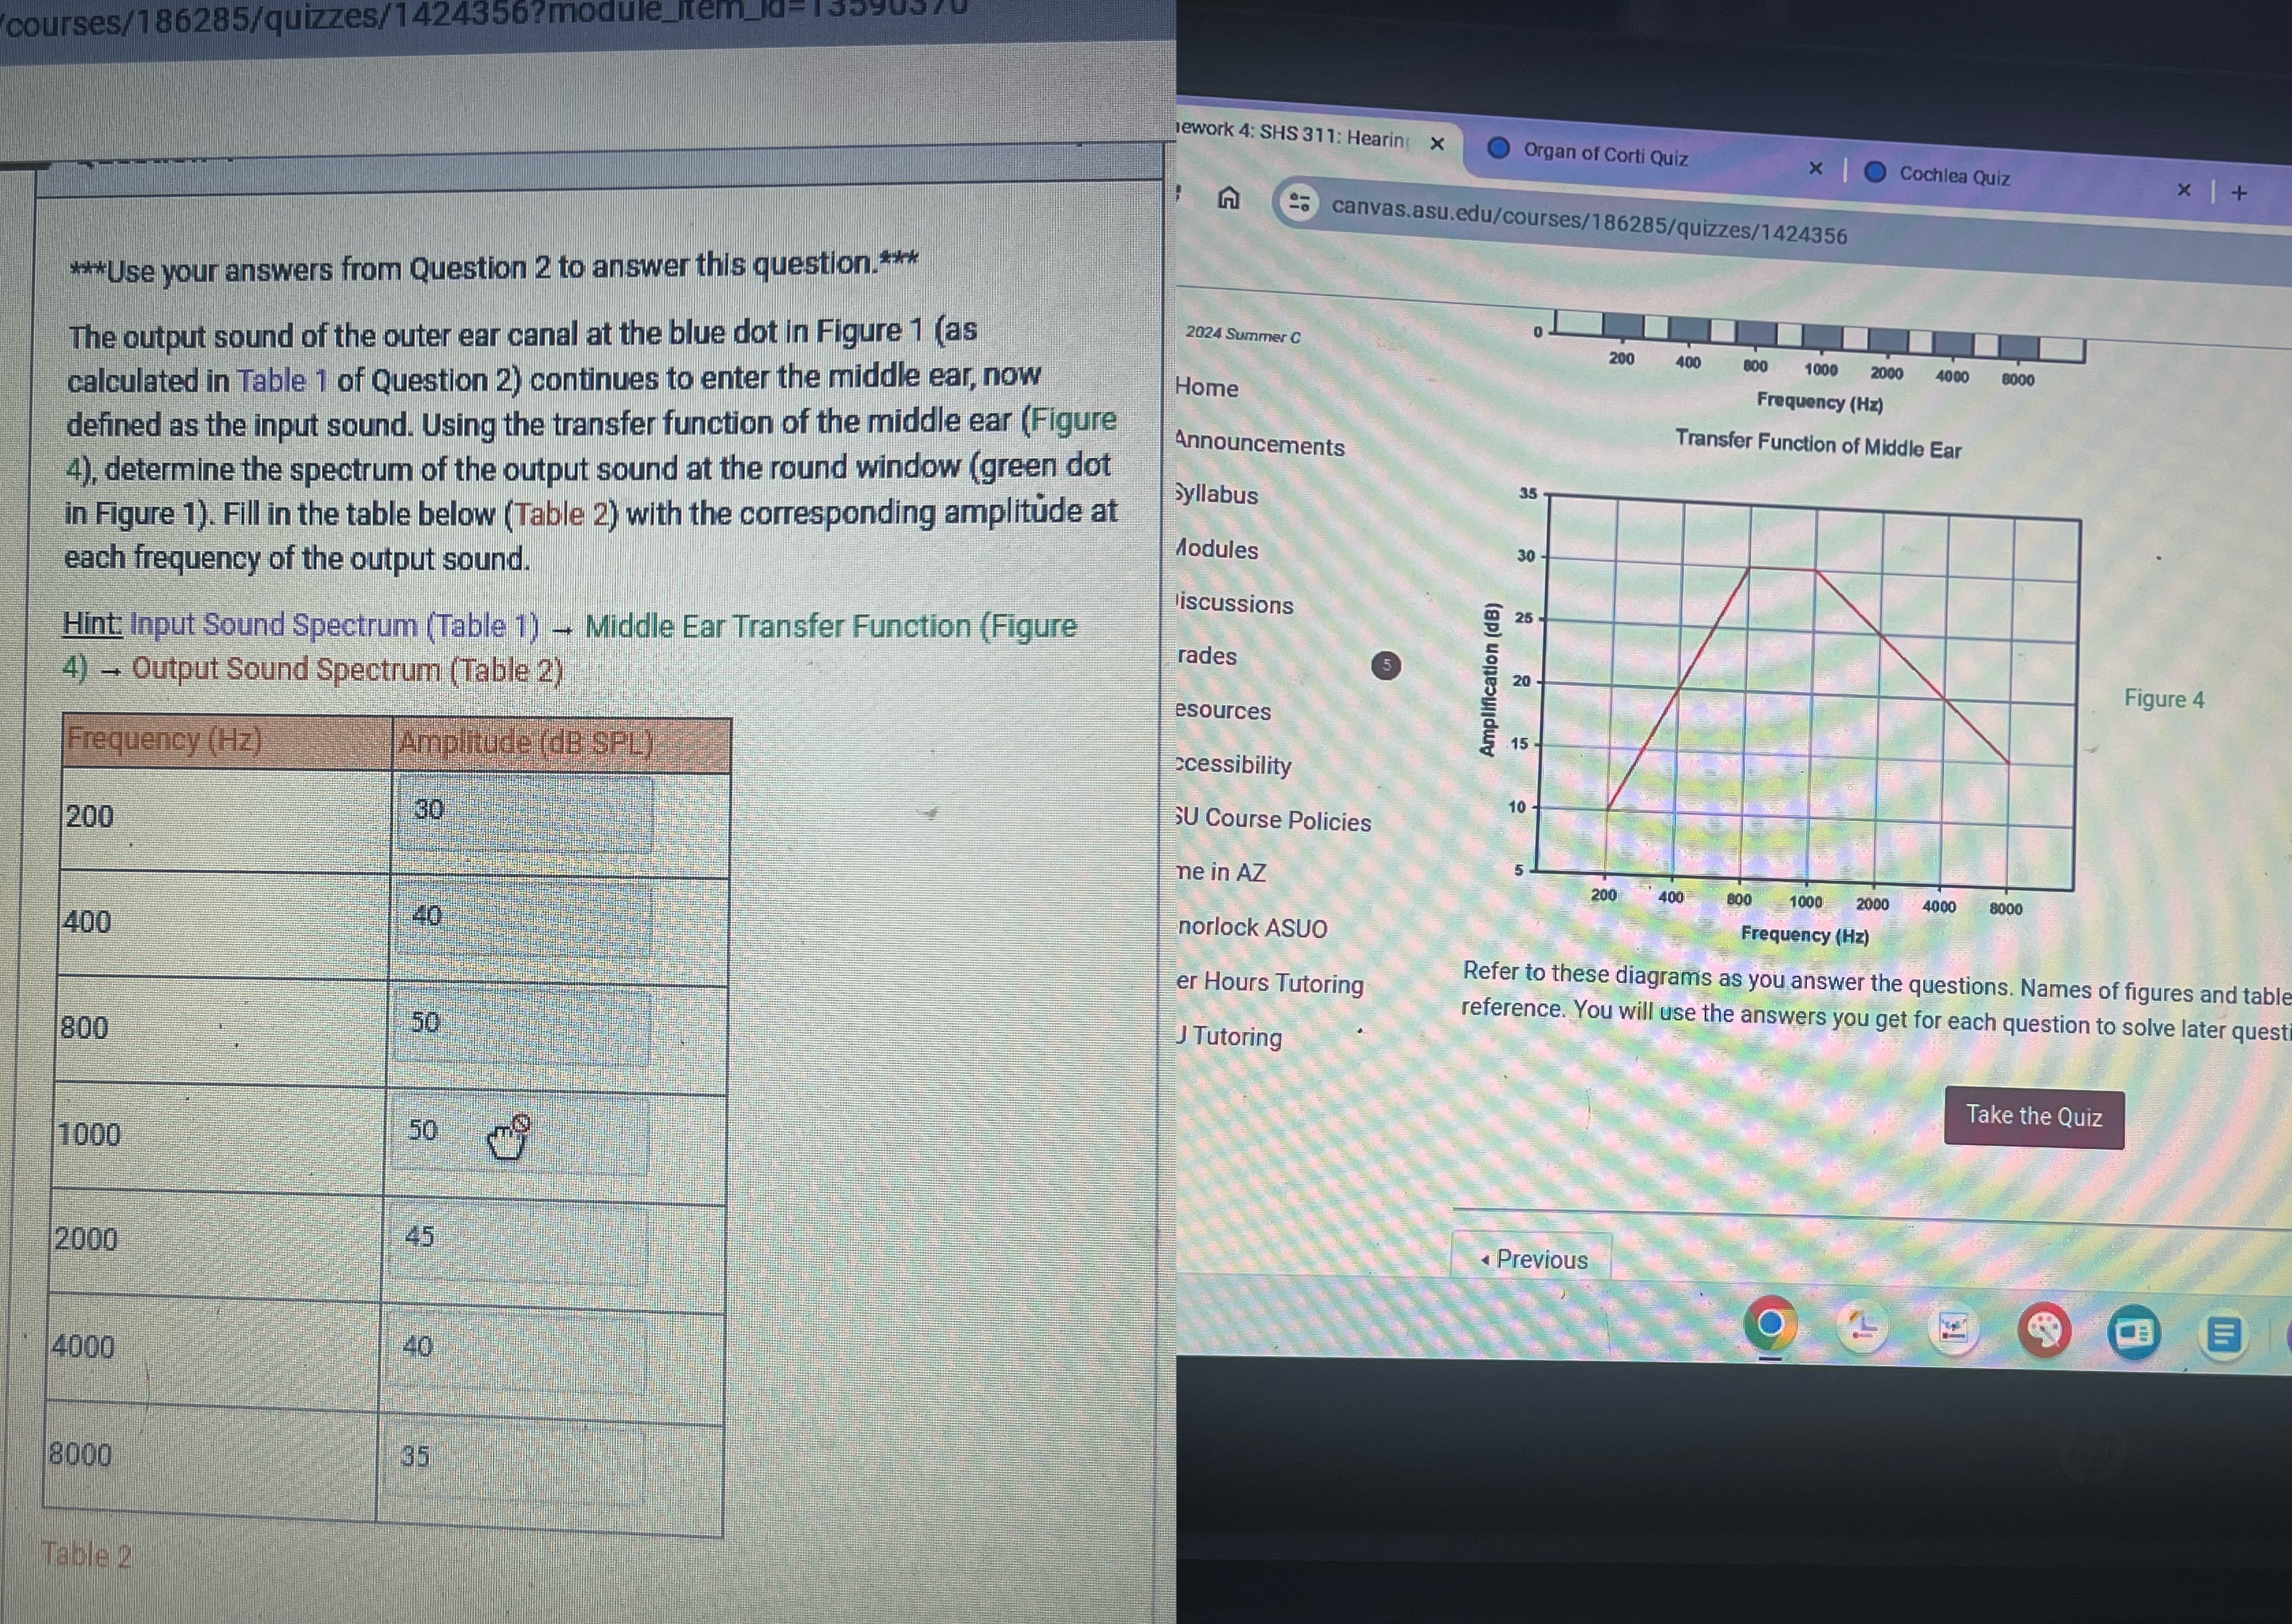
courses/186285/quizzes/1424356?module_ite lework 4: SHS 311: Hearing X Organ of Corti Quiz x | Cochlea Quiz x | + a canvas.asu.edu/courses/186285/quizzes/1424356 *Use your answers from Question 2 to answer this question.* 2024 Summer C 200 400 800 4000 The output sound of the outer ear canal at the blue dot in Figure 1 (as 2000 8000 Home Frequency (Hz) calculated in Table 1 of Question 2) continues to enter the middle ear, now Transfer Function of Middle Ear defined as the input sound. Using the transfer function of the middle ear (Figure Announcements 4), determine the spectrum of the output sound at the round window (green dot 15 Syllabus in Figure 1). Fill in the table below (Table 2) with the corresponding amplitude at Modules 30 each frequency of the output sound. liscussions 25 Hint: Input Sound Spectrum (Table 1) - Middle Ear Transfer Function (Figure rades Amplification (dB) 20 Figure 4 4) - Output Sound Spectrum (Table 2) esources 15 Frequency (Hz) ccessibility 10 SU Course Policies 200 me in AZ 200 800 2000 4000 8000 norlock ASUO Frequency (Hz) 400 Refer to these diagrams as you answer the questions. Names of figures and table er Hours Tutoring reference. You will use the answers you get for each question to solve later quest J Tutoring 800 Take the Quiz 1000 50 Previous 2000 O E 4000 40 8000
Step by Step Solution
There are 3 Steps involved in it

Get step-by-step solutions from verified subject matter experts