Question: Please fill in table and highlighted areas 2. - Use excel template & answer the following: 1. Plot the monthly sales from Exhibit 3b (graph)
 Please fill in table and highlighted areas
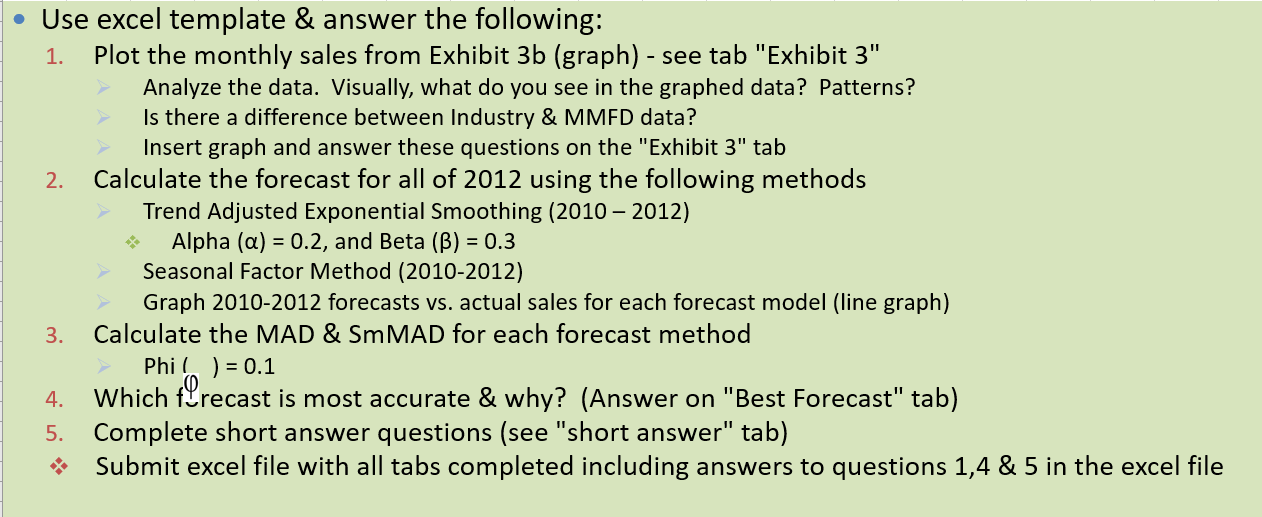
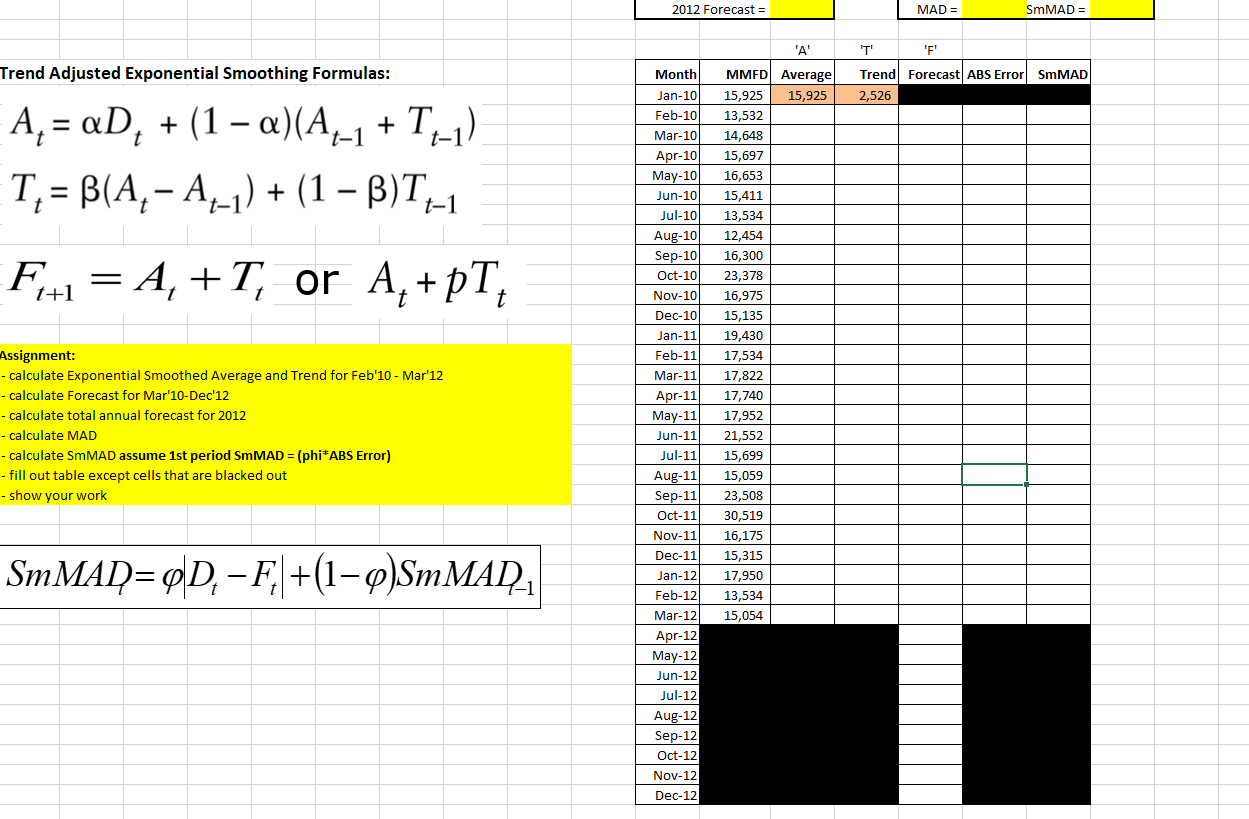
2. - Use excel template & answer the following: 1. Plot the monthly sales from Exhibit 3b (graph) - see tab "Exhibit 3" Analyze the data. Visually, what do you see in the graphed data? Patterns? Is there a difference between Industry & MMFD data? Insert graph and answer these questions on the "Exhibit 3" tab Calculate the forecast for all of 2012 using the following methods Trend Adjusted Exponential Smoothing (2010 2012) Alpha (a) = 0.2, and Beta (B) = 0.3 Seasonal Factor Method (2010-2012) Graph 2010-2012 forecasts vs. actual sales for each forecast model (line graph) 3. Calculate the MAD & SmMAD for each forecast method Phil. ) = 0.1 Which frecast is most accurate & why? (Answer on "Best Forecast" tab) 5. Complete short answer questions (see "short answer" tab) Submit excel file with all tabs completed including answers to questions 1,4 & 5 in the excel file 4. 2012 Forecast = MAD = SmMAD = 'A 'T 'F' Trend Adjusted Exponential Smoothing Formulas: Trend Forecast ABS Error SmMAD 2,526 t t A, = aD, + (1 - a)(A,-1 + T-1) T, = B(A, - A,-1) + (1 - 3)T2_1 t F-1 = A, +T, or A,+pT, = t+1 t t Month Jan-10 Feb-101 Mar-10 Apr-101 May-10 Jun-10 Jul-101 Aug-100 Sep-101 Oct-10 Nov-10 Dec-101 Jan-11 Feb-11 Mar-11 Apr-111 May-11 Jun-11 Jul-11 Aug-11 Sep-11 Oct-11 Nov-11 Dec-11 Jan-12 Feb-12) Mar-12 Apr-12 May-12 Jun-12 Jul-12 Aug-12 Sep-12 Oct-12 Nov-12 Dec-12 MMFD Average 15,925 15,925 13,532 14,648 15,697 16,653 15,411 13,534 12,454 16,300 23,378 16,975 15,135 19,430 17,534 17,822 17,740 17,952 21,552 15,699 15,059 23,508 30,519 16,175 15,315 17,950 13,534 15,054 Assignment: - calculate Exponential Smoothed Average and Trend for Feb'10 - Mar'12 - calculate Forecast for Mar'10-Dec'12 - calculate total annual forecast for 2012 - calculate MAD - calculate SmMAD assume 1st period SmMAD = (phi*ABS Error) - fill out table except cells that are blacked out - show your work SmMAN=pD; - F,[+(1-0)SmMAD -1 2. - Use excel template & answer the following: 1. Plot the monthly sales from Exhibit 3b (graph) - see tab "Exhibit 3" Analyze the data. Visually, what do you see in the graphed data? Patterns? Is there a difference between Industry & MMFD data? Insert graph and answer these questions on the "Exhibit 3" tab Calculate the forecast for all of 2012 using the following methods Trend Adjusted Exponential Smoothing (2010 2012) Alpha (a) = 0.2, and Beta (B) = 0.3 Seasonal Factor Method (2010-2012) Graph 2010-2012 forecasts vs. actual sales for each forecast model (line graph) 3. Calculate the MAD & SmMAD for each forecast method Phil. ) = 0.1 Which frecast is most accurate & why? (Answer on "Best Forecast" tab) 5. Complete short answer questions (see "short answer" tab) Submit excel file with all tabs completed including answers to questions 1,4 & 5 in the excel file 4. 2012 Forecast = MAD = SmMAD = 'A 'T 'F' Trend Adjusted Exponential Smoothing Formulas: Trend Forecast ABS Error SmMAD 2,526 t t A, = aD, + (1 - a)(A,-1 + T-1) T, = B(A, - A,-1) + (1 - 3)T2_1 t F-1 = A, +T, or A,+pT, = t+1 t t Month Jan-10 Feb-101 Mar-10 Apr-101 May-10 Jun-10 Jul-101 Aug-100 Sep-101 Oct-10 Nov-10 Dec-101 Jan-11 Feb-11 Mar-11 Apr-111 May-11 Jun-11 Jul-11 Aug-11 Sep-11 Oct-11 Nov-11 Dec-11 Jan-12 Feb-12) Mar-12 Apr-12 May-12 Jun-12 Jul-12 Aug-12 Sep-12 Oct-12 Nov-12 Dec-12 MMFD Average 15,925 15,925 13,532 14,648 15,697 16,653 15,411 13,534 12,454 16,300 23,378 16,975 15,135 19,430 17,534 17,822 17,740 17,952 21,552 15,699 15,059 23,508 30,519 16,175 15,315 17,950 13,534 15,054 Assignment: - calculate Exponential Smoothed Average and Trend for Feb'10 - Mar'12 - calculate Forecast for Mar'10-Dec'12 - calculate total annual forecast for 2012 - calculate MAD - calculate SmMAD assume 1st period SmMAD = (phi*ABS Error) - fill out table except cells that are blacked out - show your work SmMAN=pD; - F,[+(1-0)SmMAD -1


