

Question: Please fill in the 2021 sections based on the below financial statement. 2021 Accounts receivable Inventory Total assets Total liabilities Sales COGS Net income OCF
Please fill in the 2021 sections based on the below financial statement.
|
| 2021 |
|
|
| Accounts receivable |
|
|
|
| Inventory |
|
|
|
| Total assets |
|
|
|
| Total liabilities |
|
|
|
| Sales |
|
|
|
| COGS |
|
|
|
| Net income |
|
|
|
| OCF |
|
|
|
| ICF |
|
|
|
| FCF |
|
|
|
|
|
|
|
|
| 2021 | 2020 | 2019 | |
| DIH |
| 15.669 | 9.759 |
| DSO |
| 46.955 | 10.193 |
| TATO |
| 0.068 | 0.361 |
| DEBT |
| 0.730 | 0.580 |
| NPM |
| (2.615) | 0.174 |
| OCF |
| (3,731,653) | 3,716,366 |
| FCF |
| 9,349,788 | (670,371) |
| OCF+ICF |
| (5,910,219) | 624,960 |
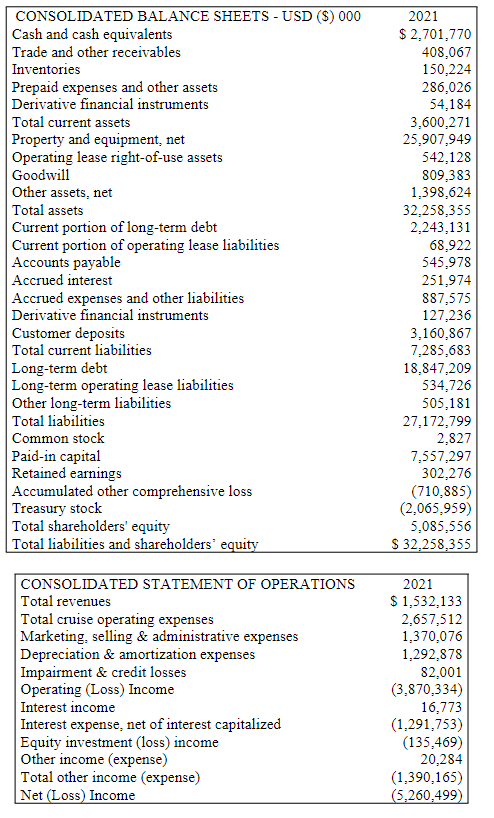
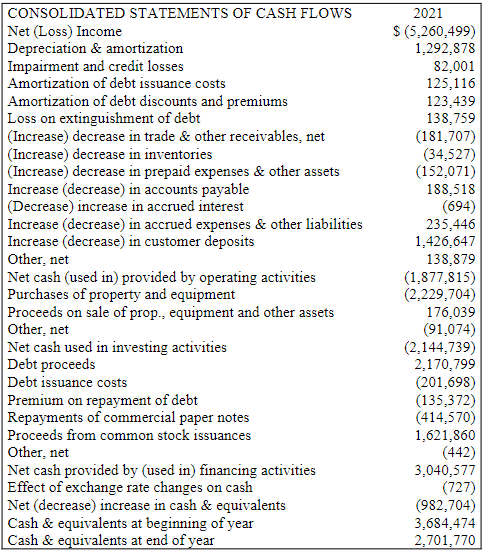
CONSOLIDATED BALANCE SHEETS - USD ($) 000 Cash and cash equivalents Trade and other receivables Inventories Prepaid expenses and other assets Derivative financial instruments Total current assets Property and equipment, net Operating lease right-of-use assets Goodwill Other assets, net Total assets Current portion of long-term debt Current portion of operating lease liabilities Accounts payable Accrued interest Accrued expenses and other liabilities Derivative financial instruments Customer deposits Total current liabilities Long-term debt Long-term operating lease liabilities Other long-term liabilities Total liabilities Common stock Paid-in capital Retained earnings Accumulated other comprehensive loss Treasury stock Total shareholders' equity Total liabilities and shareholders' equity CONSOLIDATED STATEMENT OF OPERATIONS Total revenues Total cruise operating expenses Marketing, selling & administrative expenses Depreciation & amortization expenses Impairment & credit losses Operating (Loss) Income Interest income Interest expense, net of interest capitalized Equity investment (loss) income Other income (expense) Total other income (expense) Net (Loss) Income 2021 $ 2,701,770 408,067 150,224 286,026 54,184 3,600,271 25,907,949 542,128 809,383 1,398,624 32,258,355 2,243,131 68,922 545,978 251,974 887,575 127,236 3,160,867 7,285,683 18,847,209 534,726 505,181 27,172,799 2,827 7,557,297 302,276 (710,885) (2,065,959) 5,085,556 $ 32,258,355 2021 $ 1,532,133 2,657,512 1,370,076 1,292,878 82,001 (3,870,334) 16,773 (1.291,753) (135,469) 20,284 (1,390,165) (5,260,499) CONSOLIDATED STATEMENTS OF CASH FLOWS Net (Loss) Income Depreciation & amortization Impairment and credit losses Amortization of debt issuance costs Amortization of debt discounts and premiums Loss on extinguishment of debt (Increase) decrease in trade & other receivables, net (Increase) decrease in inventories (Increase) decrease in prepaid expenses & other assets Increase (decrease) in accounts payable (Decrease) increase in accrued interest Increase (decrease) in accrued expenses & other liabilities Increase (decrease) in customer deposits Other, net Net cash (used in) provided by operating activities Purchases of property and equipment Proceeds on sale of prop., equipment and other assets Other, net Net cash used in investing activities Debt proceeds Debt issuance costs Premium on repayment of debt Repayments of commercial paper notes Proceeds from common stock issuances Other, net Net cash provided by (used in) financing activities Effect of exchange rate changes on cash Net (decrease) increase in cash & equivalents Cash & equivalents at beginning of year Cash & equivalents at end of year 2021 $ (5,260,499) 1,292,878 82,001 125,116 123,439 138,759 (181,707) (34,527) (152,071) 188,518 (694) 235,446 1,426,647 138,879 (1,877,815) (2,229,704) 176,039 (91,074) (2,144,739) 2,170,799 (201,698) (135,372) (414,570) 1,621,860 (442) 3,040,577 (727) (982,704) 3,684,474 2,701,770 CONSOLIDATED BALANCE SHEETS - USD ($) 000 Cash and cash equivalents Trade and other receivables Inventories Prepaid expenses and other assets Derivative financial instruments Total current assets Property and equipment, net Operating lease right-of-use assets Goodwill Other assets, net Total assets Current portion of long-term debt Current portion of operating lease liabilities Accounts payable Accrued interest Accrued expenses and other liabilities Derivative financial instruments Customer deposits Total current liabilities Long-term debt Long-term operating lease liabilities Other long-term liabilities Total liabilities Common stock Paid-in capital Retained earnings Accumulated other comprehensive loss Treasury stock Total shareholders' equity Total liabilities and shareholders' equity CONSOLIDATED STATEMENT OF OPERATIONS Total revenues Total cruise operating expenses Marketing, selling & administrative expenses Depreciation & amortization expenses Impairment & credit losses Operating (Loss) Income Interest income Interest expense, net of interest capitalized Equity investment (loss) income Other income (expense) Total other income (expense) Net (Loss) Income 2021 $ 2,701,770 408,067 150,224 286,026 54,184 3,600,271 25,907,949 542,128 809,383 1,398,624 32,258,355 2,243,131 68,922 545,978 251,974 887,575 127,236 3,160,867 7,285,683 18,847,209 534,726 505,181 27,172,799 2,827 7,557,297 302,276 (710,885) (2,065,959) 5,085,556 $ 32,258,355 2021 $ 1,532,133 2,657,512 1,370,076 1,292,878 82,001 (3,870,334) 16,773 (1.291,753) (135,469) 20,284 (1,390,165) (5,260,499) CONSOLIDATED STATEMENTS OF CASH FLOWS Net (Loss) Income Depreciation & amortization Impairment and credit losses Amortization of debt issuance costs Amortization of debt discounts and premiums Loss on extinguishment of debt (Increase) decrease in trade & other receivables, net (Increase) decrease in inventories (Increase) decrease in prepaid expenses & other assets Increase (decrease) in accounts payable (Decrease) increase in accrued interest Increase (decrease) in accrued expenses & other liabilities Increase (decrease) in customer deposits Other, net Net cash (used in) provided by operating activities Purchases of property and equipment Proceeds on sale of prop., equipment and other assets Other, net Net cash used in investing activities Debt proceeds Debt issuance costs Premium on repayment of debt Repayments of commercial paper notes Proceeds from common stock issuances Other, net Net cash provided by (used in) financing activities Effect of exchange rate changes on cash Net (decrease) increase in cash & equivalents Cash & equivalents at beginning of year Cash & equivalents at end of year 2021 $ (5,260,499) 1,292,878 82,001 125,116 123,439 138,759 (181,707) (34,527) (152,071) 188,518 (694) 235,446 1,426,647 138,879 (1,877,815) (2,229,704) 176,039 (91,074) (2,144,739) 2,170,799 (201,698) (135,372) (414,570) 1,621,860 (442) 3,040,577 (727) (982,704) 3,684,474 2,701,770
Step by Step Solution
There are 3 Steps involved in it

Get step-by-step solutions from verified subject matter experts