

Question: Please fill in the following chart if it cannot be filled in please leave it blank thank you! begin{tabular}{|l|l|l|l|l|l|} hline Data & 2015 & 2016
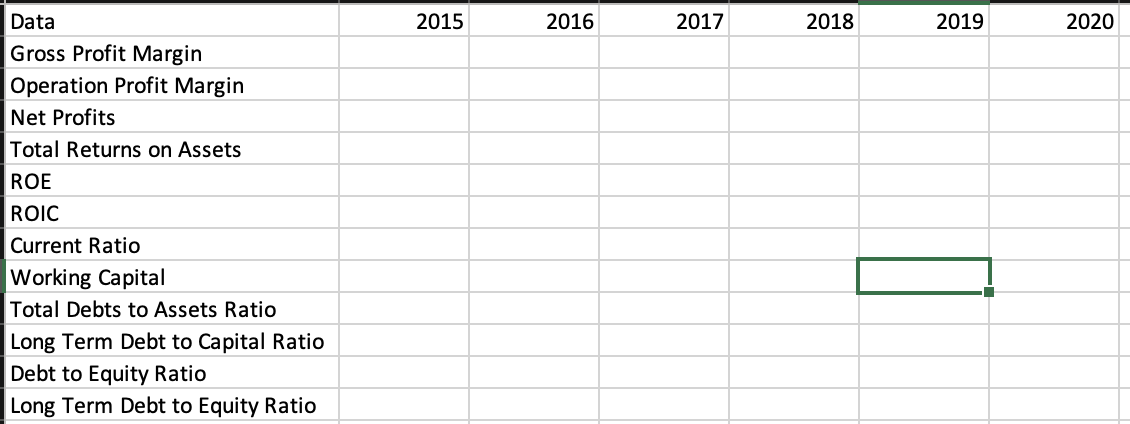
Please fill in the following chart if it cannot be filled in please leave it blank thank you!
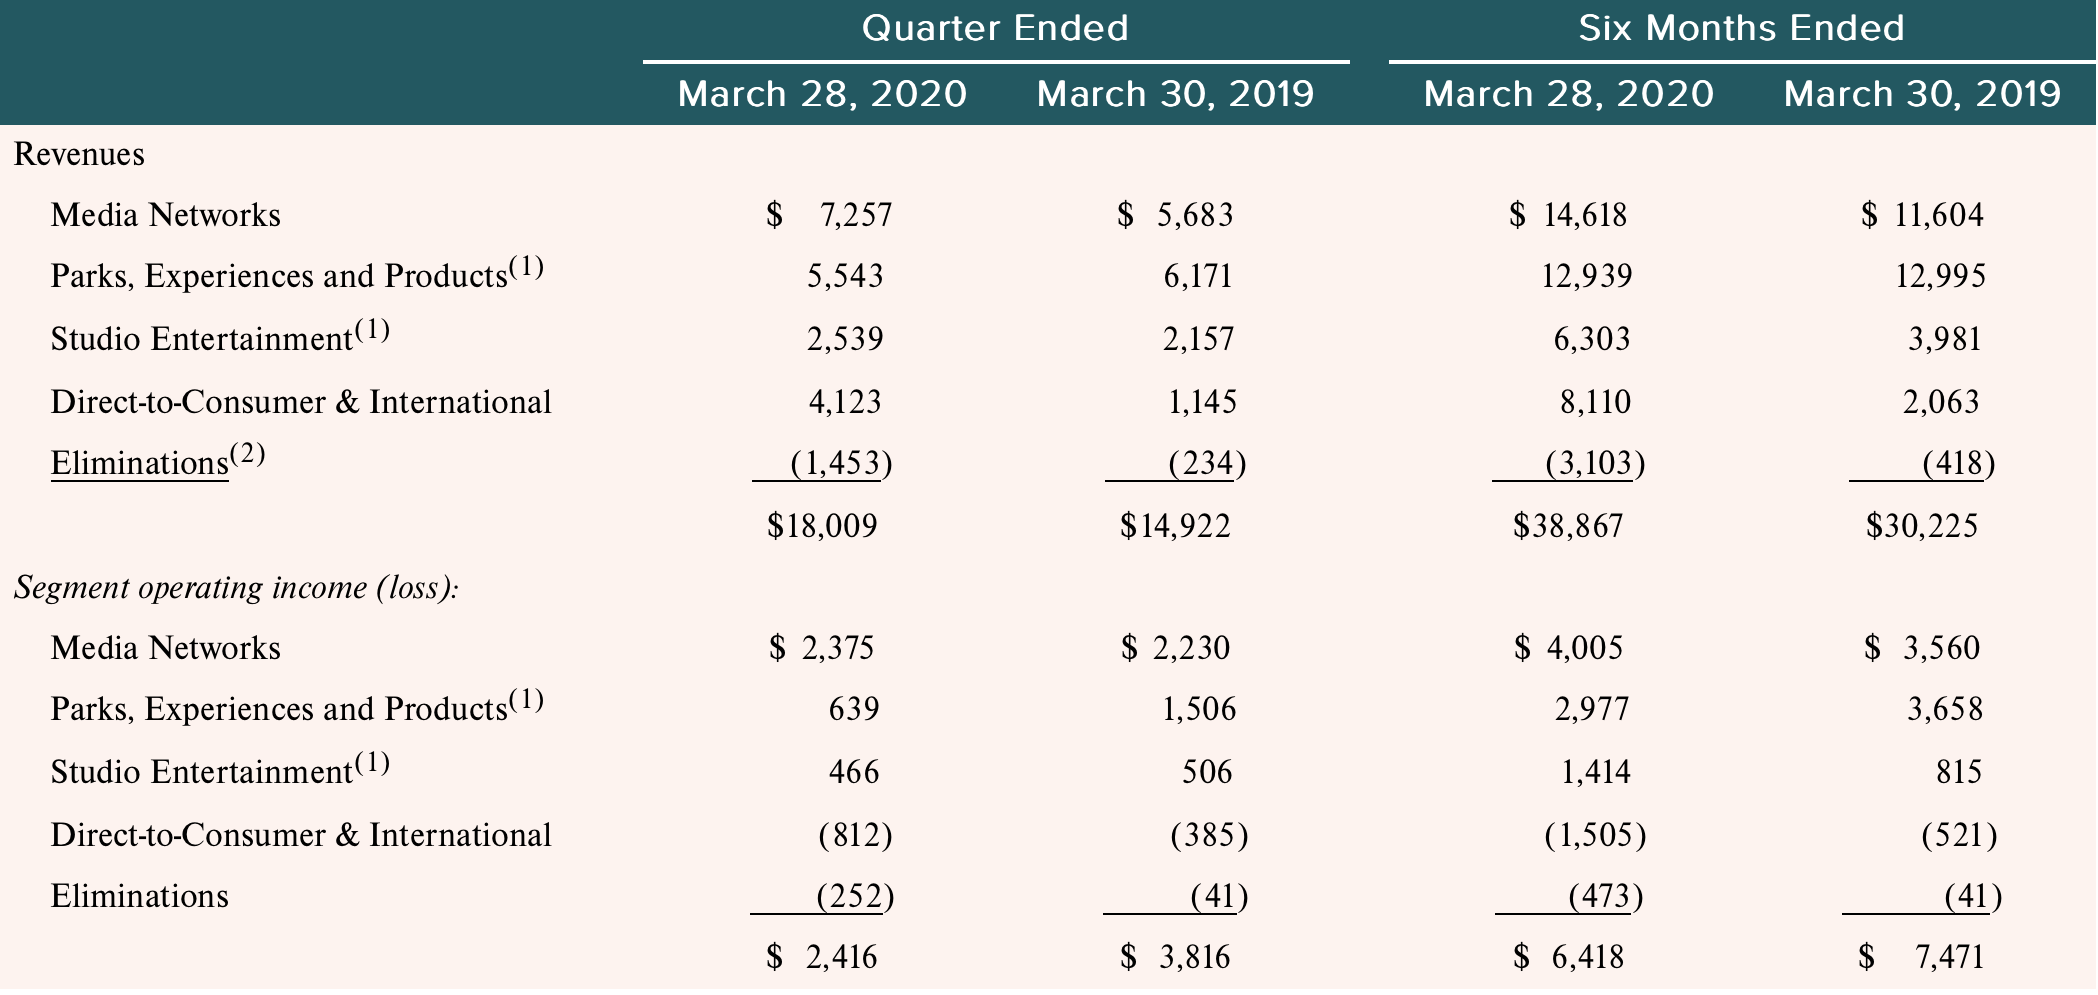
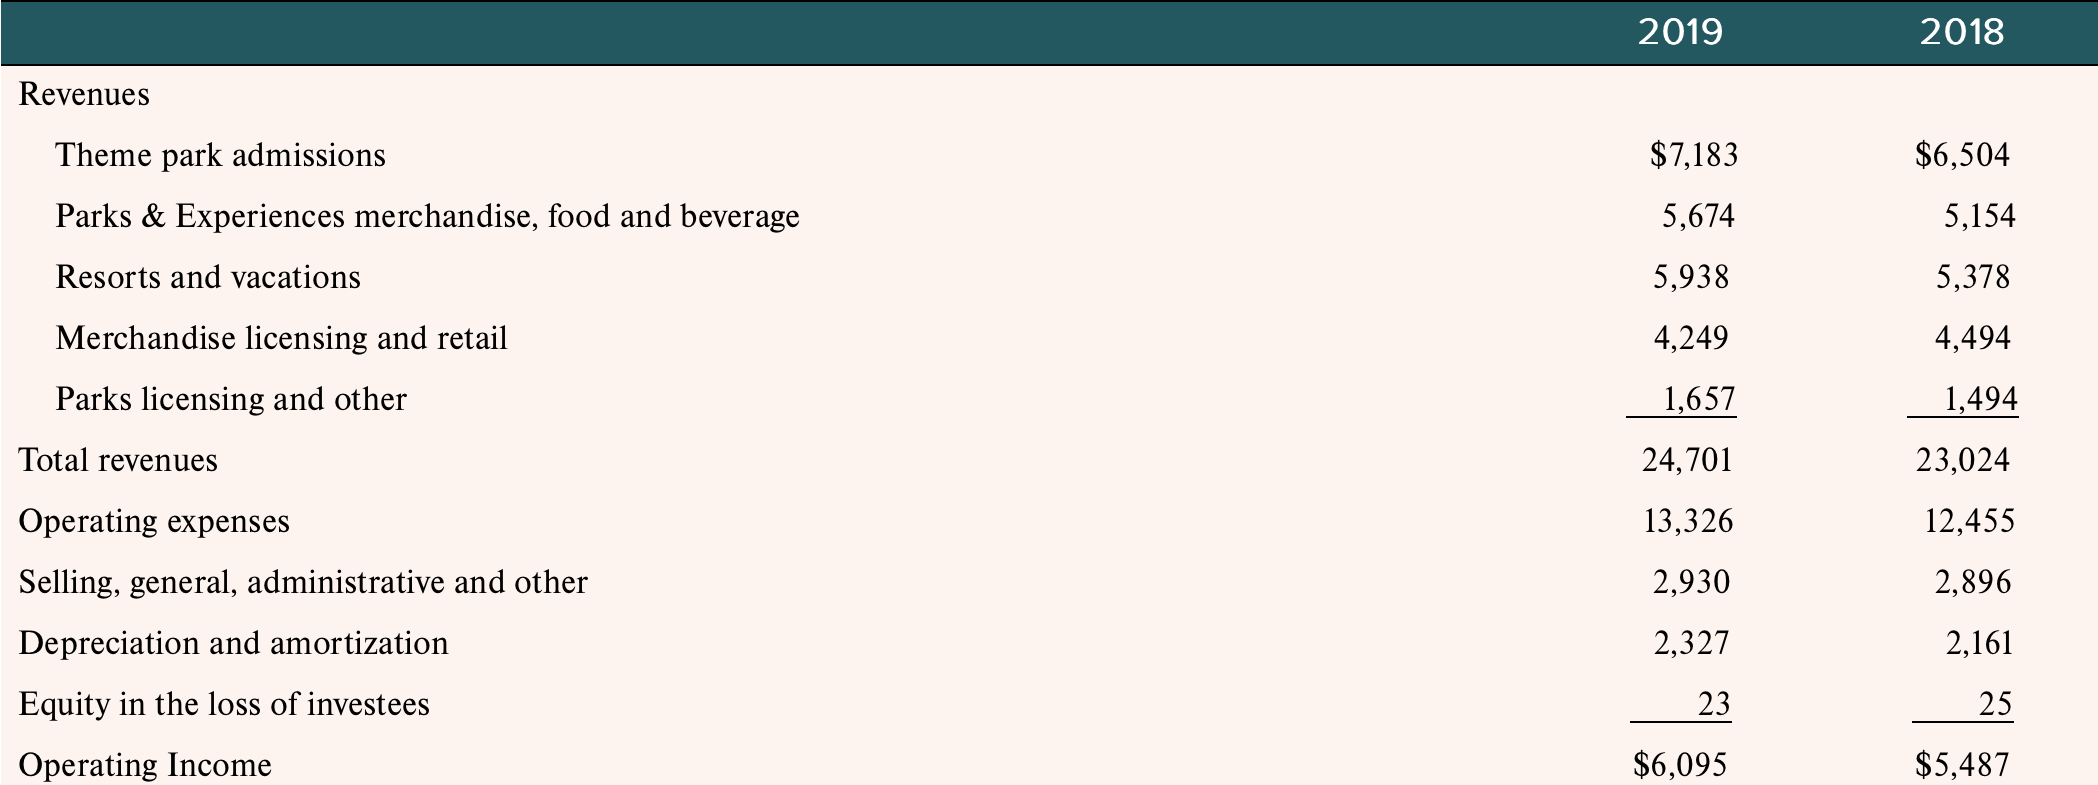
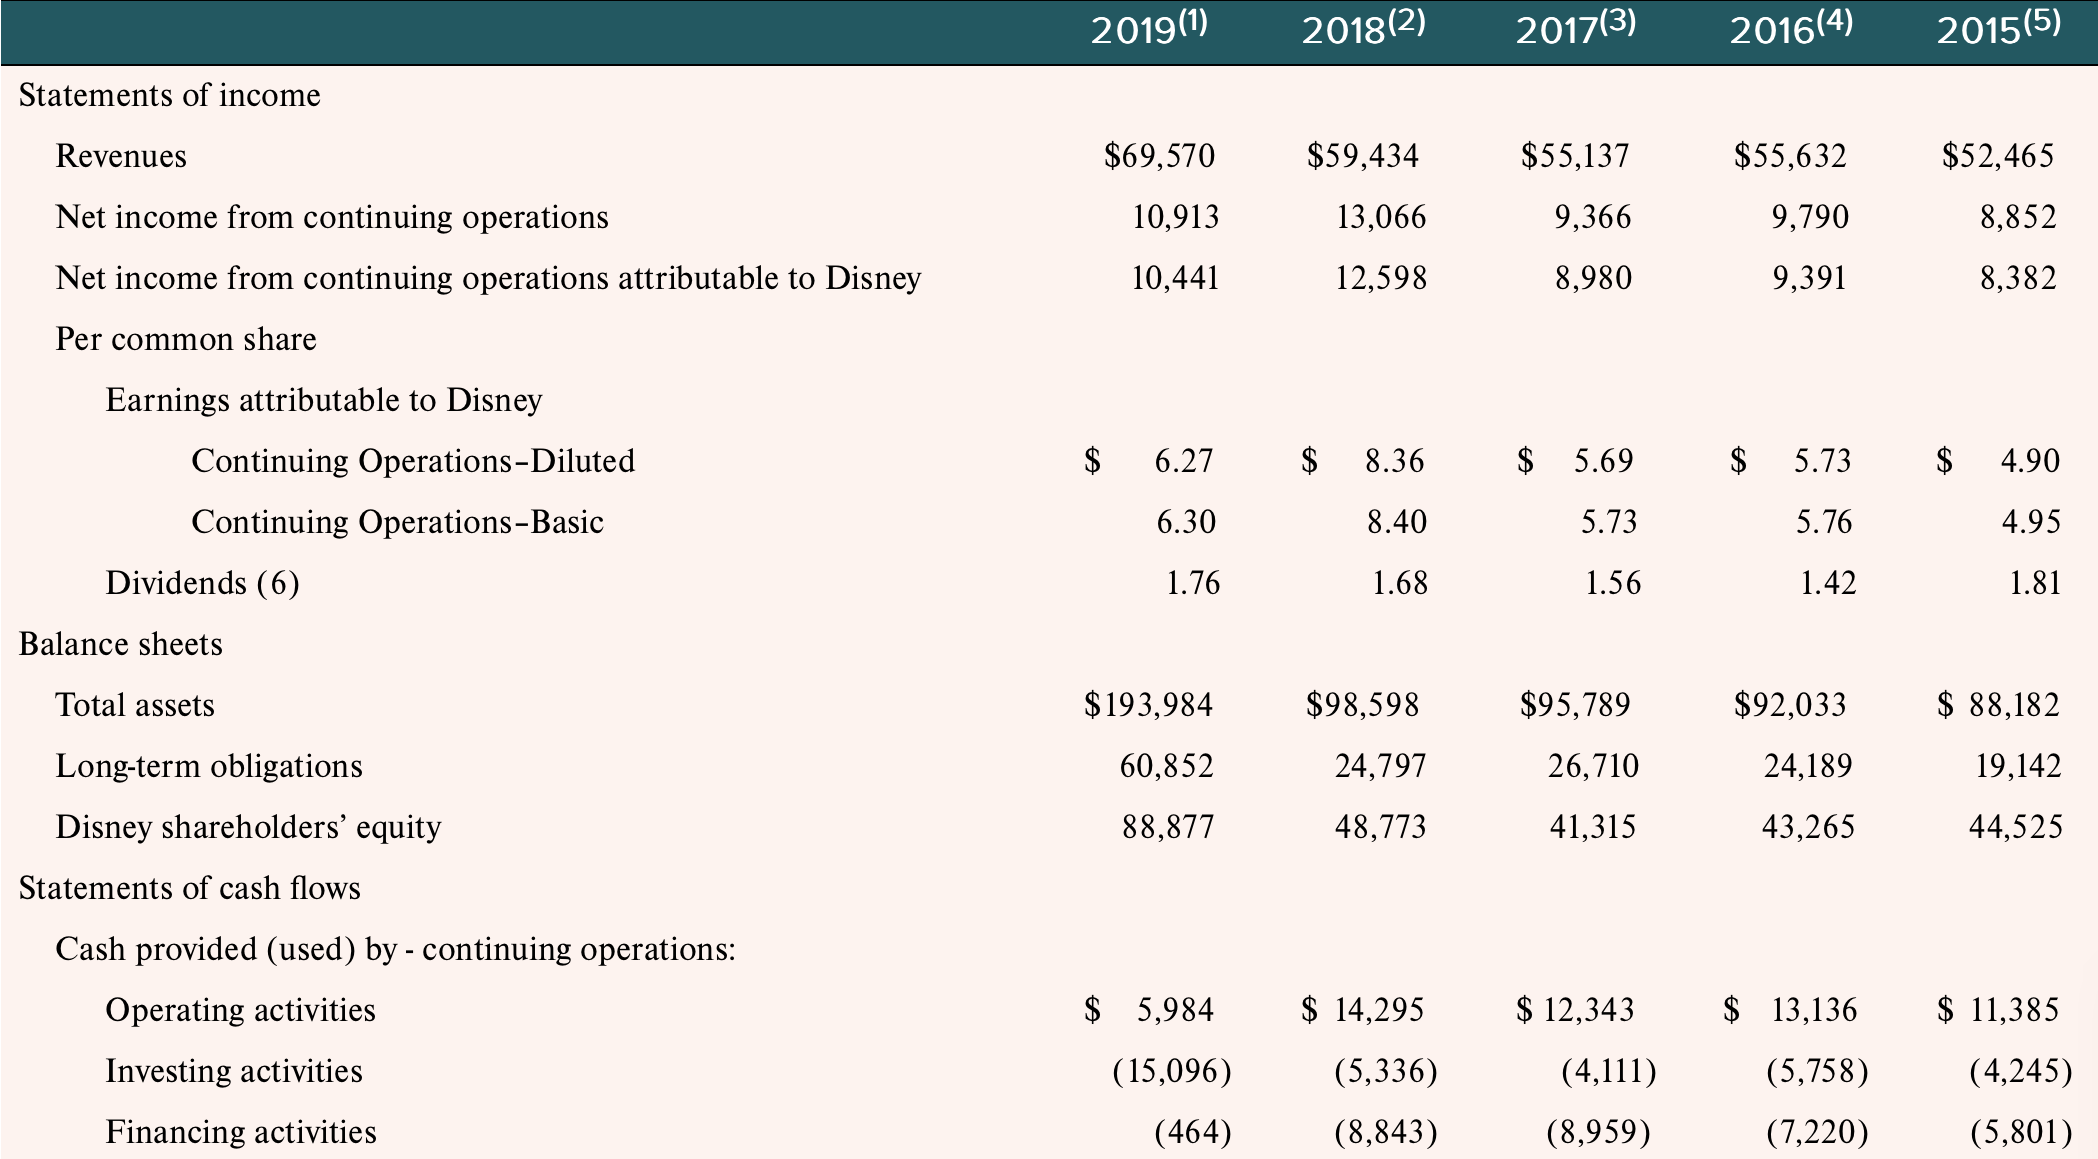
\begin{tabular}{|l|l|l|l|l|l|} \hline Data & 2015 & 2016 & 2017 & & 2019 \\ \hline Gross Profit Margin & & & & & \\ \hline Operation Profit Margin & & & & & \\ \hline Net Profits & & & & & \\ \hline Total Returns on Assets & & & & \\ \hline ROE & & & & \\ \hline ROIC & & & & \\ \hline Current Ratio & & & & \\ \hline Working Capital & & & & \\ \hline Total Debts to Assets Ratio & & & & \\ \hline Long Term Debt to Capital Ratio & & & & \\ \hline Debt to Equity Ratio & & & & \\ \hline Long Term Debt to Equity Ratio & & & & \\ \hline \end{tabular} Quarter Ended Six Months Ended March 28, 2020 March 30, 2019 March 28, 2020 March 30, 2019 Revenues Media Networks Parks, Experiences and Products (1) Studio Entertainment (1) Direct-to-Consumer \& International Eliminations(2) Segment operating income (loss): Media Networks Parks, Experiences and Products (1) Studio Entertainment (1) Direct-to-Consumer \& International Eliminations $7,257 5,543 2,539 4,123 (1,453) $18,009 $2,375 639 466 (812) (252) $2,416 $5,683 6,171 2,157 1,145 (234) $14,922 $2,230 1,506 506 (385) (41) $3,816 $14,618 12,939 6,303 8,110 (3,103) $38,867 $4,005 2,977 1,414 (1,505) (473) $6,418 \$11,604 12,995 3,981 2,063 (418) $30,225 $3,560 3,658 815 (521) (41) (41) 7,471 \begin{tabular}{lrr} & 2019 & 2018 \\ \hline Revenues & & \\ Theme park admissions & $7,183 & $6,504 \\ Parks \& Experiences merchandise, food and beverage & 5,674 & 5,154 \\ Resorts and vacations & 5,938 & 5,378 \\ Merchandise licensing and retail & 4,249 & 4,494 \\ Parks licensing and other & 1,657 & 1,494 \\ \cline { 2 - 4 } Total revenues & 24,701 & 23,024 \\ Operating expenses & 13,326 & 12,455 \\ Selling, general, administrative and other & 2,930 & 2,896 \\ Depreciation and amortization & 2,327 & 2,161 \\ Equity in the loss of investees & 23 & 25 \\ Operating Income & $6,095 & $5,487 \end{tabular} 2019(1)2018(2)2017(3)2016(4)2015(5) Statements of income Revenues Net income from continuing operations Net income from continuing operations attributable to Disney Per common share Earnings attributable to Disney Continuing Operations-Diluted Continuing Operations-Basic Dividends (6) Balance sheets Total assets Long-term obligations Disney shareholders' equity Statements of cash flows Cash provided (used) by - continuing operations: Operating activities Investing activities Financing activities \begin{tabular}{rrrrr} $69,570 & $59,434 & $55,137 & $55,632 & $52,465 \\ 10,913 & 13,066 & 9,366 & 9,790 & 8,852 \\ 10,441 & 12,598 & 8,980 & 9,391 & 8,382 \end{tabular} \begin{tabular}{|c|c|c|c|c|} \hline 6.27 & 8.36 & 5.69 & 5.73 & $ \\ \hline 6.30 & 8.40 & 5.73 & 5.76 & \\ \hline 1.76 & 1.68 & 1.56 & 1.42 & \\ \hline$193,984 & $98,598 & $95,789 & $92,033 & $ \\ \hline 60,852 & 24,797 & 26,710 & 24,189 & \\ \hline 88,877 & 48,773 & 41,315 & 43,265 & \\ \hline \end{tabular} \begin{tabular}{rrrrr} $5,984 & $14,295 & $12,343 & $13,136 & $11,385 \\ (15,096) & (5,336) & (4,111) & (5,758) & (4,245) \\ (464) & (8,843) & (8,959) & (7,220) & (5,801) \end{tabular}
Step by Step Solution
There are 3 Steps involved in it

Get step-by-step solutions from verified subject matter experts