Question: Please fill in the missing information below in regards to stocks based on the info below for Buckle Consolidated Statements of Earnings (in millions of
Please fill in the missing information below in regards to stocks based on the info below for Buckle
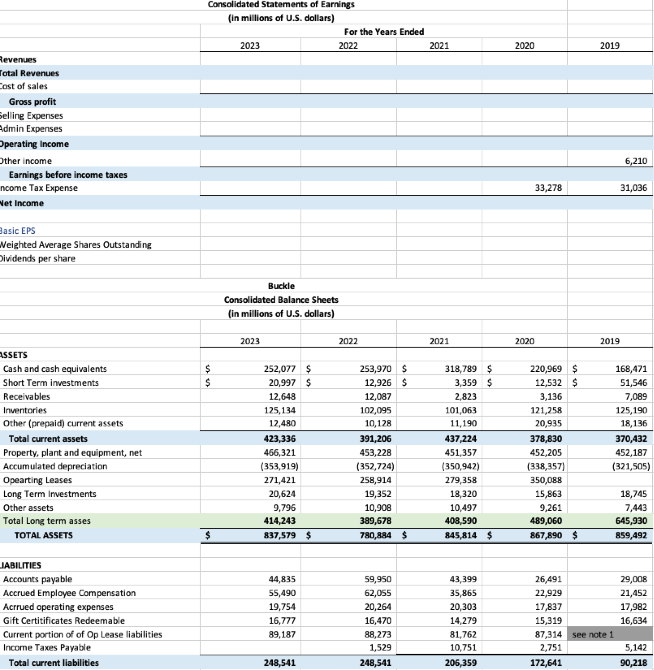
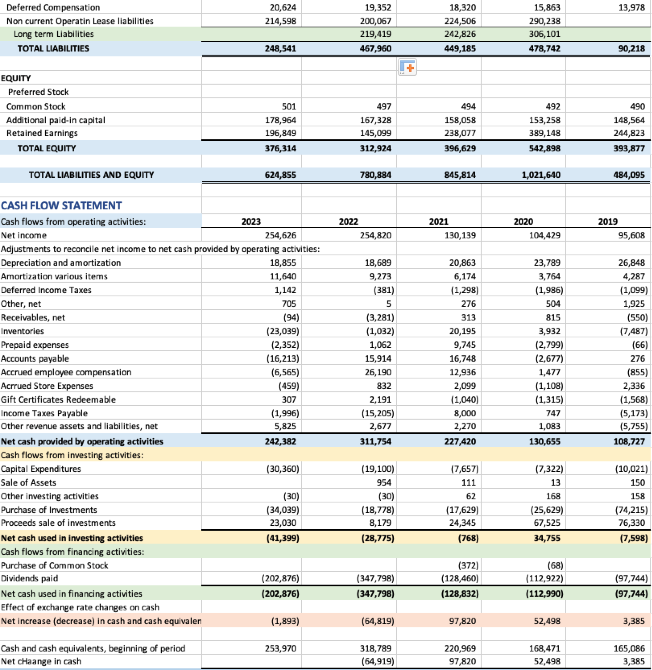
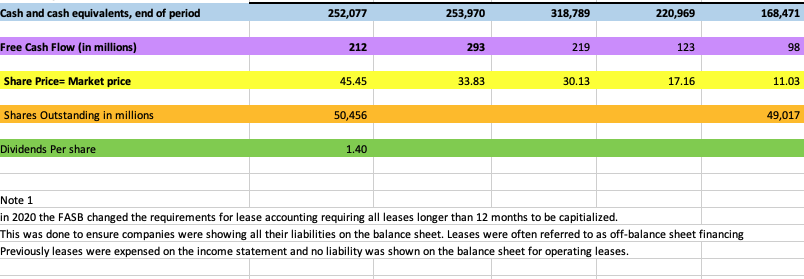
Consolidated Statements of Earnings (in millions of U.S. dollars) For the Years Ended 1023 2022 2021 2020 2019 Revenues otal Revenues Cost of sales Gross profit Selling Expenses Admin Expenses Operating Income Other income 6,210 Earnings before income taxes ncome Tax Expense 33,278 31,036 Net Income Basic EPS Veighted Average Shares Outstanding Dividends per share Buckle Consolidated Balance Sheets (in millions of U.S. dollars) 2023 2023 2021 2020 2019 ASSETS Cash and cash equivalents 252,077 $ 253,970 $ 318,789 5 220,969 5 168,471 Short Term investments 20,997 $ 12,926 $ 3,359 5 12,532 $ 51,546 Receivables 12,648 12,087 2,823 3,136 7,089 Inventories 125,134 102,095 101,063 121,258 125,190 Other (prepaid) current assets 17,480 10,128 11,140 20,935 18,136 Total current assets 423,336 391,206 437,224 378,830 370,432 Property, plant and equipment, net 466,321 453,228 451,357 452,205 452,187 Accumulated depreciation (353,919) (352,724) (350,947) (338,357] (321,505) Opearting Leases 271,421 258,914 279,358 350,088 Long Term Investments 20,624 19,352 18,320 15,863 18,745 Other assets 9,796 10,908 10,497 0,261 7,443 Total Long term asses 414,243 389,678 408,590 489,060 645,930 TOTAL ASSETS $ 847,579 780,484 $ 845,814 $ 867,890 $ 859,492 JABILITIES Accounts payable 44,835 59,950 43 399 26,491 29,008 Accrued Employee Compensation 55,490 62,055 35,865 22,929 21,452 Acrrued operating expenses 19,754 20,264 20,303 17,837 17,982 Gift Certitificates Redeemable 16,777 16,470 14,279 15,319 16,634 Current portion of of Op Lease liabilities 19.187 38,273 91,762 87,314 see note 1 Income Taxes Payable 1,529 10,751 2,751 5,142 Total current liabilities 248,541 248,541 206,359 172,641 90,218Deferred Compensation 20,624 19.352 18,320 15.863 19,978 Non current Operatin Lease liabilities 214,598 200,067 224,506 290,238 Long term Liabilities 219,419 242,826 306, 101 TOTAL LIABILITIES 248,541 467.960 449,185 478,742 90,21 + EQUITY Preferred Stock Common Stock 501 497 494 492 490 Additional paid-in capital 178,964 167,328 158,058 153,258 148,564 Retained Earnings 196,849 145,099 238,077 389,148 244,823 TOTAL EQUITY 476,314 412,924 196,629 542,898 193,877 TOTAL LIABILITIES AND EQUITY 624,855 780,884 845,814 1,021,640 484,095 CASH FLOW STATEMENT Cash flows from operating activities: 2023 2027 2021 2020 2019 Net income 254,626 254,820 130,139 104,429 95,608 Adjustments to reconcile net income to net cash provided by operating activities: Depreciation and amortization 18,855 18,689 20,863 23,789 26,848 Amortization various items 11,640 3,27 5,174 3,764 4,287 Deferred Income Taxes 1,142 (381) 1,298 1,986) (1,099 Other, net 705 276 504 1,925 Receivables, net (94) (3,281) 313 815 (550 Inventories (23,039) (1,032) 20,195 3,932 (7,487 Prepaid expenses (2,352) 1,062 9,745 2,799 (66 Accounts payable (16,213) 15,914 16,748 2,677) 276 Accrued employee compensation (6,565) 26,190 12,936 1,477 855) Acrrued Store Expenses (459) 832 2,099 (1,108) 2,336 Gift Certificates Redeemable 307 2.191 (1,040 (1,315 (1,568] Income Taxes Payable (1,996) (15,205) 8,0DO 747 (5,173] Other revenue assets and liabilities, net 5,825 2,677 2,270 1,083 (5,755] Net cash provided by operating activities 242,387 311,754 227,420 130,655 108,727 Cash flows from investing activities Capital Expend tures (30,360) (19,100) 17,657) (7,322 (10,021 Sale of Assets 954 111 13 150 Other investing activities (30) (30 62 168 158 Purchase of Investments (34,039) (18,778) (17,629 (25,629 (74,215 Proceeds sale of investments 23,030 8,179 24,345 7,525 76,330 Net cash used in investing activities (41,399) (28,775) 768 34,755 7,598 Cash flows from financing activities: Purchase of Common Stock (372] (68) Dividends paid (202,876) 347,798 (128,460 112,922) (97,744 Net cash used in financing activities (202,876) (347,798) (128,832] (112,990) (97,744] Effect of exchange rate changes on cash Net increase (decrease) in cash and cash equivalen (1,893] (64,819) 97,820 52,498 3,385 Cash and cash equivalents, beginning of period 253,970 318,789 220,969 168,471 165,086 Net chaange in cash (64,919) 97 820 67,498 3,385Cash and cash equivalents, end of period 252,077 253,970 318,789 220,969 168,471 Free Cash Flow (in millions) 212 293 219 123 98 Share Price= Market price 45.45 33.83 30.13 17.16 11.03 Shares Outstanding in millions 50,456 49,017 Dividends Per share 1.40 Note 1 in 2020 the FASB changed the requirements for lease accounting requiring all leases longer than 12 months to be capitialized. This was done to ensure companies were showing all their liabilities on the balance sheet. Leases were often referred to as off-balance sheet financing Previously leases were expensed on the income statement and no liability was shown on the balance sheet for operating leases
Step by Step Solution
There are 3 Steps involved in it
1 Expert Approved Answer
Step: 1 Unlock
Question Has Been Solved by an Expert!
Get step-by-step solutions from verified subject matter experts
Step: 2 Unlock
Step: 3 Unlock
Students Have Also Explored These Related Finance Questions!