

Question: please fill in the yellow D E 5 F 5 Bentley Corporation's most recent financial statements. Use the following ratios and other selected information for
please fill in the yellow
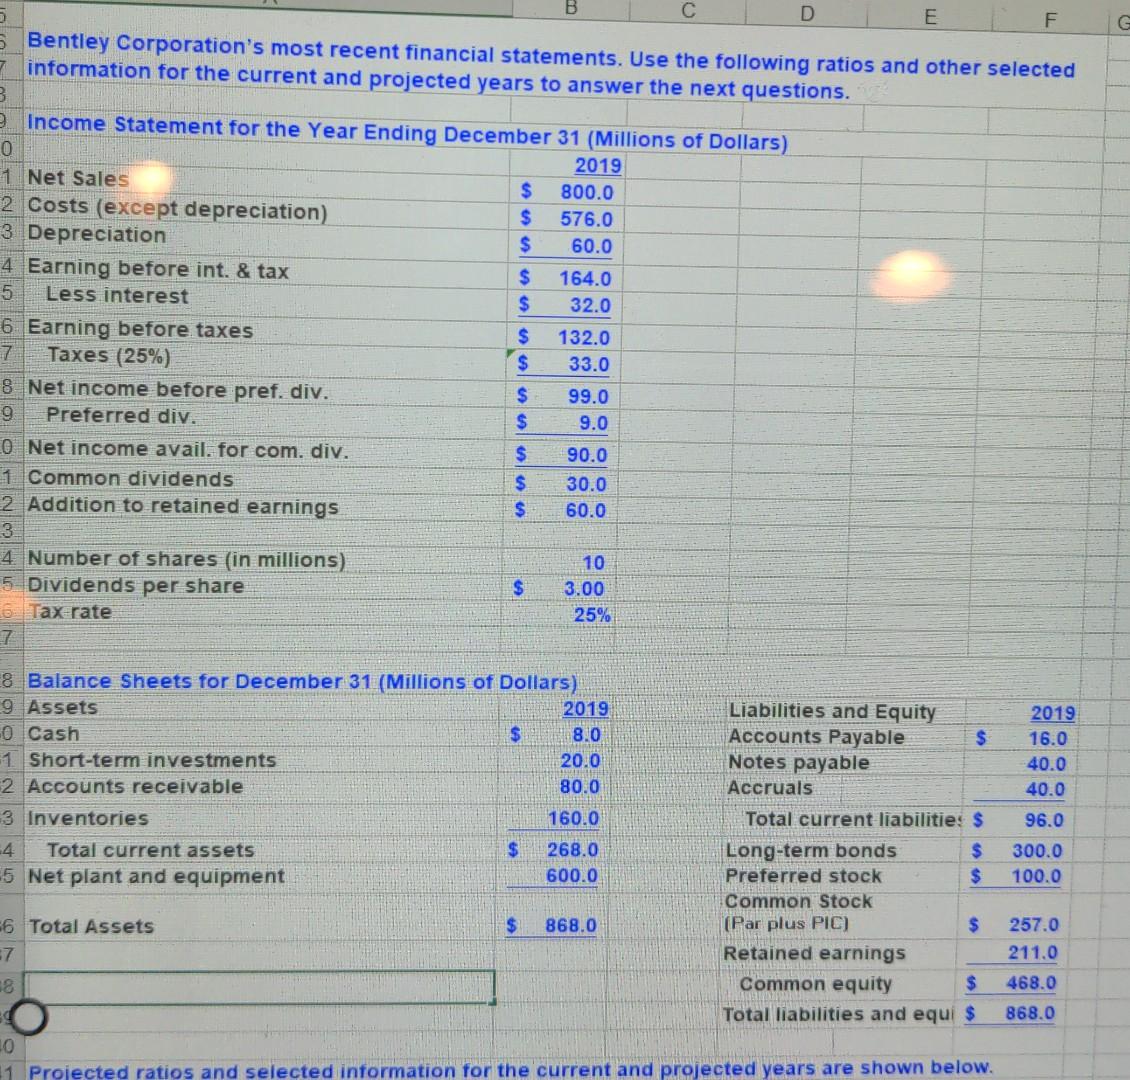
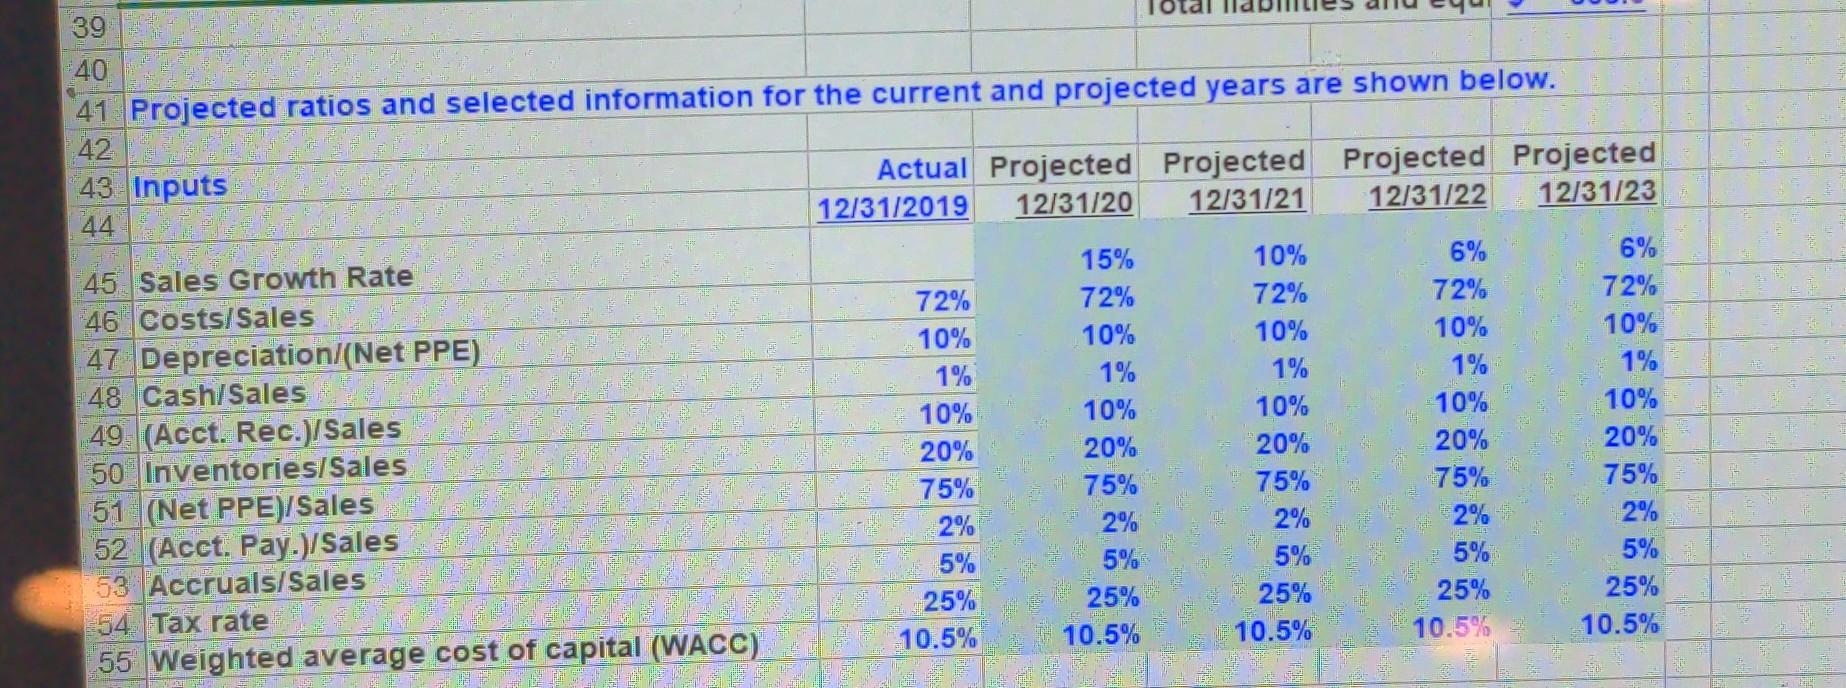
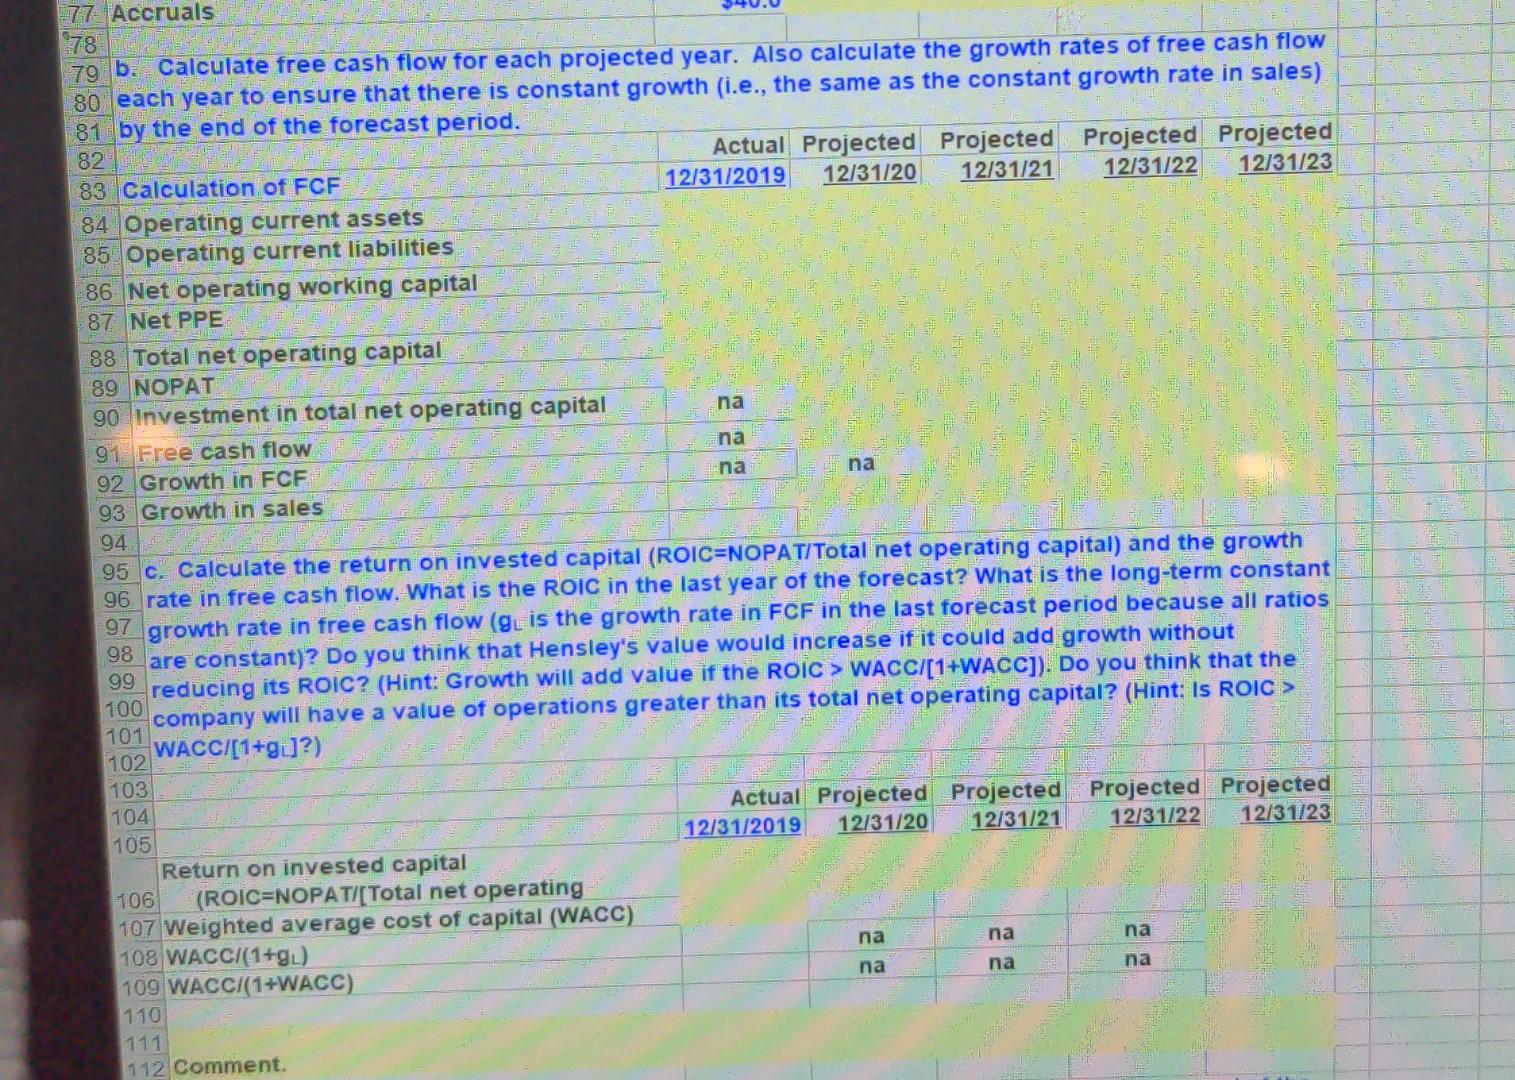
D E 5 F 5 Bentley Corporation's most recent financial statements. Use the following ratios and other selected information for the current and projected years to answer the next questions. B Income Statement for the Year Ending December 31 (Millions of Dollars) 0 2019 1 Net Sales $ 800.0 2 Costs (except depreciation) $ 576.0 3 Depreciation $ 60.0 4 Earning before int. & tax $ 164.0 5 Less interest $ 32.0 6 Earning before taxes $ 132.0 7 Taxes (25%) $ 33.0 8 Net income before pref. div. $ 99.0 9 Preferred div. $ 9.0 0 Net income avail. for com. div. $ 90.0 1 Common dividends $ 30.0 2 Addition to retained earnings $ 60.0 3 4 Number of shares (in millions) 10 5 Dividends per share $ 3.00 Tax rate 25% 7 ulu 8 Balance Sheets for December 31 (Millions of Dollars) 9 Assets 2019 0 Cash $ 8.0 1 Short-term investments 20.0 2 Accounts receivable 80.0 3 Inventories 160.0 4 Total current assets $ 268.0 5 Net plant and equipment 600.0 2019 16.0 40.0 40.0 Liabilities and Equity Accounts Payable $ Notes payable Accruals Total current liabilitie: $ Long-term bonds $ Preferred stock $ Common Stock Par plus PIC) $ Retained earnings Common equity $ Total liabilities and equi $ 96.0 300.0 100.0 $ 868.0 6 Total Assets 7 18 257.0 211.0 468.0 868.0 10 1 Projected ratios and selected information for the current and projected years are shown below. 39 40 41 Projected ratios and selected information for the current and projected years are shown below. 42 43. Inputs Actual Projected Projected Projected Projected 44 12/31/2019 12/31/20 12/31/21 12/31/22 12/31/23 45 Sales Growth Rate 15% 10% 6% 6% 46 Costs/Sales 72% 72% 72% 72% 72% 10% 47 Depreciation/(Net PPE) 10% 10% 10% 10% 48 Cash/Sales 1% 1% 1% 1% 49: (Acct. Rec.)/Sales 10% 10% 10% 10% 10% 50 Inventories/Sales 20% 20% 20% 20% 75% 51 (Net PPE)/Sales 75% 75% 75% 2% 52 (Acct. Pay.)/Sales 2% 2% 2% 5% 5% 5% 53 Accruals/Sales 25% 25% 25% 54 Tax rate 25% 25% 10.5% 10.5% 10.5% 10.5% 55 Weighted average cost of capital (WACC) 10.5% 1% 5% na na 77 Accruals 78 79 b. Calculate free cash flow for each projected year. Also calculate the growth rates of free cash flow 80 each year to ensure that there is constant growth (i.e., the same as the constant growth rate in sales) 81 by the end of the forecast period. 82 Actual Projected Projected Projected Projected 83 Calculation of FCF 12/31/2019 12/31/20 12/31/21 12/31/22 12/31/23 84 Operating current assets 85 Operating current liabilities 86 Net operating working capital 87 Net PPE 88 Total net operating capital 89 NOPAT 90 Investment in total net operating capital 91 Free cash flow 92 Growth in FCF na na 93 Growth in sales 94 95 c. Calculate the return on invested capital (ROIC=NOPAT/Total net operating capital) and the growth 96 rate in free cash flow. What is the ROIC in the last year of the forecast? What is the long-term constant 97 growth rate in free cash flow (gl is the growth rate in FCF in the last forecast period because all ratios 98 are constant)? Do you think that Hensley's value would increase if it could add growth without 99 reducing its ROIC? (Hint: Growth will add value if the ROIC > WACCI[1+WACC]). Do you think that the 100 company will have a value of operations greater than its total net operating capital? (Hint: Is ROIC > 101 WACCI[1+g.]?) 102 103 104 Actual Projected Projected Projected Projected 105 12/31/2019 12/31/20 12/31/21 12/31/22 12/31/23 Return on invested capital 106 (ROIC=NOPATI[Total net operating 107 Weighted average cost of capital (WACC) 108 WACCI(1+) na 109 WACCI(1+WACC) 110 111 112 Comment na na na na na
Step by Step Solution
There are 3 Steps involved in it

Get step-by-step solutions from verified subject matter experts