

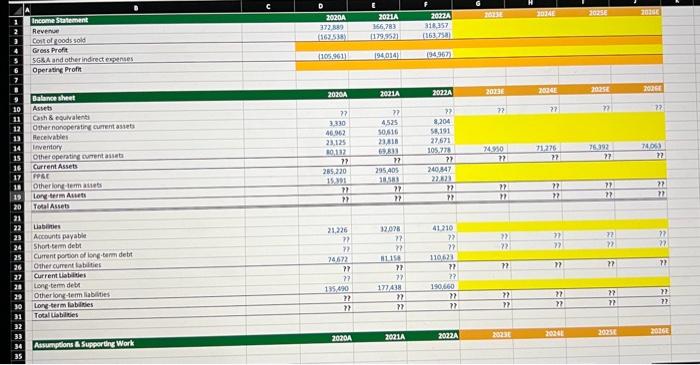
Question: please fill in yellow squares or provide excel formulas for yellow squares on column 'G' so that i may extrapolate it to the other units
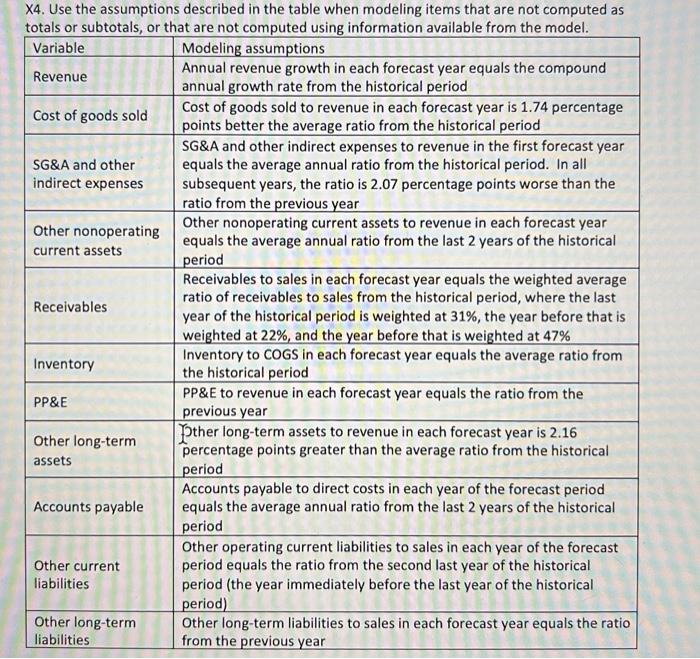
X4. Use the assumptions described in the table when modeling items that are not computed as totals or subtotals, or that are not computed using information available from the model. \begin{tabular}{|c|c|} \hline Variable & Modeling assumptions \\ \hline Revenue & \begin{tabular}{l} Annual revenue growth in each forecast year equals the compound \\ annual growth rate from the historical period \end{tabular} \\ \hline Cost of goods sold & \begin{tabular}{l} Cost of goods sold to revenue in each forecast year is 1.74 percentage \\ points better the average ratio from the historical period \end{tabular} \\ \hline \begin{tabular}{l} SG\&A and other \\ indirect expenses \end{tabular} & \begin{tabular}{l} SG\&A and other indirect expenses to revenue in the first forecast year \\ equals the average annual ratio from the historical period. In all \\ subsequent years, the ratio is 2.07 percentage points worse than the \\ ratio from the previous year \end{tabular} \\ \hline \begin{tabular}{l} Other nonoperating \\ current assets \end{tabular} & \begin{tabular}{l} Other nonoperating current assets to revenue in each forecast year \\ equals the average annual ratio from the last 2 years of the historical \\ period \end{tabular} \\ \hline Receivables & \begin{tabular}{l} Receivables to sales in each forecast year equals the weighted average \\ ratio of receivables to sales from the historical period, where the last \\ year of the historical period is weighted at 31%, the year before that is \\ weighted at 22%, and the year before that is weighted at 47% \end{tabular} \\ \hline Inventory & \begin{tabular}{l} Inventory to COGS in each forecast year equals the average ratio from \\ the historical period \end{tabular} \\ \hline PP\&E & \begin{tabular}{l} PP\&E to revenue in each forecast year equals the ratio from the \\ previous year \end{tabular} \\ \hline \begin{tabular}{l} Other long-term \\ assets \end{tabular} & \begin{tabular}{l} Ther long-term assets to revenue in each forecast year is 2.16 \\ percentage points greater than the average ratio from the historical \\ period \end{tabular} \\ \hline Accounts payable & \begin{tabular}{l} Accounts payable to direct costs in each year of the forecast period \\ equals the average annual ratio from the last 2 years of the historical \\ period \end{tabular} \\ \hline \begin{tabular}{l} Other current \\ liabilities \end{tabular} & \begin{tabular}{l} Other operating current liabilities to sales in each year of the forecast \\ period equals the ratio from the second last year of the historical \\ period (the year immediately before the last year of the historical \\ period) \end{tabular} \\ \hline \begin{tabular}{l} Other long-term \\ liabilities \end{tabular} & \begin{tabular}{l} Other long-term liabilities to sales in each forecast year equals the ratio \\ from the previous year \end{tabular} \\ \hline \end{tabular} X4. Use the assumptions described in the table when modeling items that are not computed as totals or subtotals, or that are not computed using information available from the model. \begin{tabular}{|c|c|} \hline Variable & Modeling assumptions \\ \hline Revenue & \begin{tabular}{l} Annual revenue growth in each forecast year equals the compound \\ annual growth rate from the historical period \end{tabular} \\ \hline Cost of goods sold & \begin{tabular}{l} Cost of goods sold to revenue in each forecast year is 1.74 percentage \\ points better the average ratio from the historical period \end{tabular} \\ \hline \begin{tabular}{l} SG\&A and other \\ indirect expenses \end{tabular} & \begin{tabular}{l} SG\&A and other indirect expenses to revenue in the first forecast year \\ equals the average annual ratio from the historical period. In all \\ subsequent years, the ratio is 2.07 percentage points worse than the \\ ratio from the previous year \end{tabular} \\ \hline \begin{tabular}{l} Other nonoperating \\ current assets \end{tabular} & \begin{tabular}{l} Other nonoperating current assets to revenue in each forecast year \\ equals the average annual ratio from the last 2 years of the historical \\ period \end{tabular} \\ \hline Receivables & \begin{tabular}{l} Receivables to sales in each forecast year equals the weighted average \\ ratio of receivables to sales from the historical period, where the last \\ year of the historical period is weighted at 31%, the year before that is \\ weighted at 22%, and the year before that is weighted at 47% \end{tabular} \\ \hline Inventory & \begin{tabular}{l} Inventory to COGS in each forecast year equals the average ratio from \\ the historical period \end{tabular} \\ \hline PP\&E & \begin{tabular}{l} PP\&E to revenue in each forecast year equals the ratio from the \\ previous year \end{tabular} \\ \hline \begin{tabular}{l} Other long-term \\ assets \end{tabular} & \begin{tabular}{l} Ther long-term assets to revenue in each forecast year is 2.16 \\ percentage points greater than the average ratio from the historical \\ period \end{tabular} \\ \hline Accounts payable & \begin{tabular}{l} Accounts payable to direct costs in each year of the forecast period \\ equals the average annual ratio from the last 2 years of the historical \\ period \end{tabular} \\ \hline \begin{tabular}{l} Other current \\ liabilities \end{tabular} & \begin{tabular}{l} Other operating current liabilities to sales in each year of the forecast \\ period equals the ratio from the second last year of the historical \\ period (the year immediately before the last year of the historical \\ period) \end{tabular} \\ \hline \begin{tabular}{l} Other long-term \\ liabilities \end{tabular} & \begin{tabular}{l} Other long-term liabilities to sales in each forecast year equals the ratio \\ from the previous year \end{tabular} \\ \hline \end{tabular}
Step by Step Solution
There are 3 Steps involved in it

Get step-by-step solutions from verified subject matter experts