

Question: Please fill missing figures in the projections presented on the following page: WACC denominator re donominator 1 1,061 1,070 2 1,125 1,141 3 1,194 1,219
- Please fill missing figures in the projections presented on the following page:
-
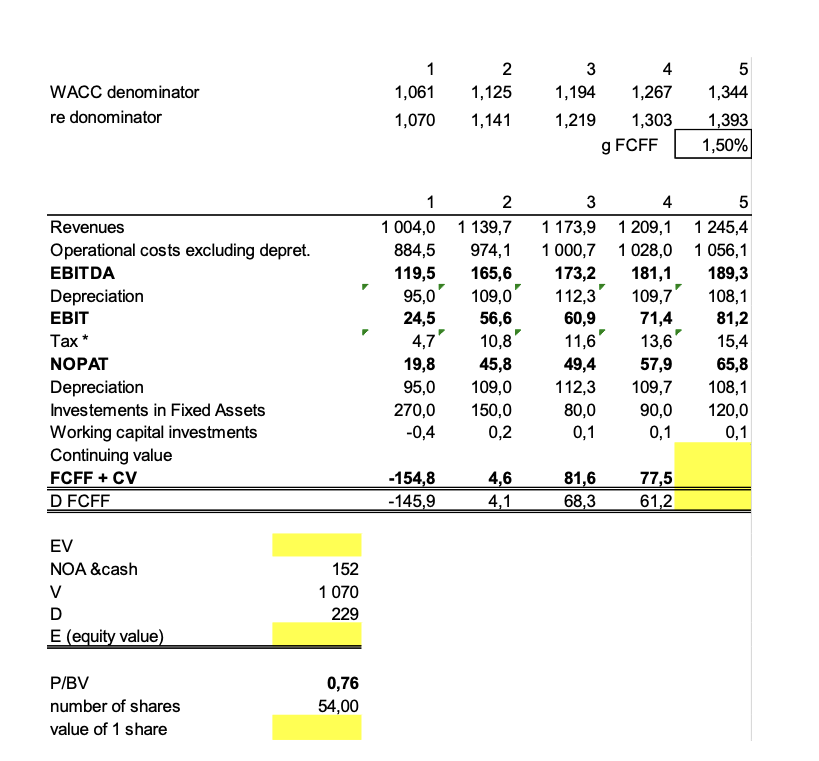
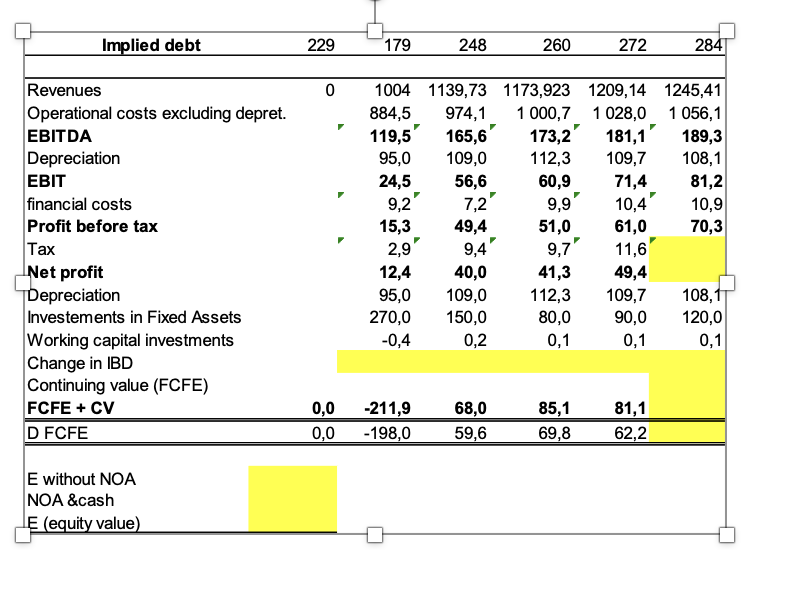
WACC denominator re donominator 1 1,061 1,070 2 1,125 1,141 3 1,194 1,219 4 1,267 1,303 5 1,344 1,393 1,50% g FCFF 1 2 1 004,0 1139,7 884,5 974,1 119,5 165,6 95,0 109,0" 24,5 56,6 10,8' 19,8 45,8 95,0 109,0 270,0 150,0 -0,4 0,2 Revenues Operational costs excluding depret. EBITDA Depreciation EBIT Tax* NOPAT Depreciation Investements in Fixed Assets Working capital investments Continuing value FCFF + CV D FCFF 3 4 5 1 173,91 209,1 1 245,4 1 000,7 1028,0 1056,1 173,2 181,1 189,3 112,3 109,7' 108,1 60,9 71,4 81,2 11,6' 13,6 15,4 49,4 57,9 65,8 112,3 109,7 108,1 80,0 90,0 120,0 0,1 0,1 0,1 4,7' -154,8 -145,9 4,6 4,1 81,6 68,3 77,5 61,2 EV NOA &cash V D E (equity value) 152 1 070 229 P/BV number of shares value of 1 share 0,76 54,00 Implied debt 229 179 248 260 272 284 0 9,2' 9,9' Revenues Operational costs excluding depret. EBITDA Depreciation EBIT financial costs Profit before tax Tax Net profit Depreciation Investements in Fixed Assets Working capital investments Change in IBD Continuing value (FCFE) FCFE + CV D FCFE 1004 1139,73 1173,923 1209,14 1245,41 884,5 974,1 1 000,7 1028,0 1 056,1 119,5' 165,6' 173,2 181,1 189,3 95,0 109,0 112,3 109,7 108,1 24,5 56,6 60,9 71,4 81,2 7,2 10,4' 10,9 15,3 49,4 51,0 61,0 70,3 2,9 9,4 9,7' 11,6 12,4 40,0 41,3 49,4 95,0 109,0 112,3 109,7 108,11 270,0 150,0 80,0 90,0 120,0 -0,4 0,2 0,1 0,1 0,1 0,0 0,0 -211,9 - 198,0 68,0 59,6 85,1 69,8 81,1 62,2 E without NOA NOA &cash E (equity value) WACC denominator re donominator 1 1,061 1,070 2 1,125 1,141 3 1,194 1,219 4 1,267 1,303 5 1,344 1,393 1,50% g FCFF 1 2 1 004,0 1139,7 884,5 974,1 119,5 165,6 95,0 109,0" 24,5 56,6 10,8' 19,8 45,8 95,0 109,0 270,0 150,0 -0,4 0,2 Revenues Operational costs excluding depret. EBITDA Depreciation EBIT Tax* NOPAT Depreciation Investements in Fixed Assets Working capital investments Continuing value FCFF + CV D FCFF 3 4 5 1 173,91 209,1 1 245,4 1 000,7 1028,0 1056,1 173,2 181,1 189,3 112,3 109,7' 108,1 60,9 71,4 81,2 11,6' 13,6 15,4 49,4 57,9 65,8 112,3 109,7 108,1 80,0 90,0 120,0 0,1 0,1 0,1 4,7' -154,8 -145,9 4,6 4,1 81,6 68,3 77,5 61,2 EV NOA &cash V D E (equity value) 152 1 070 229 P/BV number of shares value of 1 share 0,76 54,00 Implied debt 229 179 248 260 272 284 0 9,2' 9,9' Revenues Operational costs excluding depret. EBITDA Depreciation EBIT financial costs Profit before tax Tax Net profit Depreciation Investements in Fixed Assets Working capital investments Change in IBD Continuing value (FCFE) FCFE + CV D FCFE 1004 1139,73 1173,923 1209,14 1245,41 884,5 974,1 1 000,7 1028,0 1 056,1 119,5' 165,6' 173,2 181,1 189,3 95,0 109,0 112,3 109,7 108,1 24,5 56,6 60,9 71,4 81,2 7,2 10,4' 10,9 15,3 49,4 51,0 61,0 70,3 2,9 9,4 9,7' 11,6 12,4 40,0 41,3 49,4 95,0 109,0 112,3 109,7 108,11 270,0 150,0 80,0 90,0 120,0 -0,4 0,2 0,1 0,1 0,1 0,0 0,0 -211,9 - 198,0 68,0 59,6 85,1 69,8 81,1 62,2 E without NOA NOA &cash E (equity value)
Step by Step Solution
There are 3 Steps involved in it

Get step-by-step solutions from verified subject matter experts