

Question: Please fill out blue boxes. Free Cash Flow Calculation Pro Forma => 2013 2014 2015 2016 2017 EBIT 68 70 74 75 80 EBIT(1-t) tax
Please fill out blue boxes.
| Free Cash Flow Calculation | Pro Forma => | ||||||||
| 2013 | 2014 | 2015 | 2016 | 2017 | |||||
| EBIT | 68 | 70 | 74 | 75 | 80 | ||||
| EBIT(1-t) | tax rate = | 40% | |||||||
| Depreciation | |||||||||
| Capital expenditures | |||||||||
| NWC | |||||||||
| Free cash flow | |||||||||
| Terminal value | Perp. g = | 3% | |||||||
| 2017--FC F + TV | |||||||||
| DCF Enterprise | |||||||||
| Less EOY 2008 Debt | 301 | ||||||||
| Estimated Equity Value | |||||||||
| number of shares (000,000s) | 10.0 | ||||||||
| Value per share | $ | ||||||||
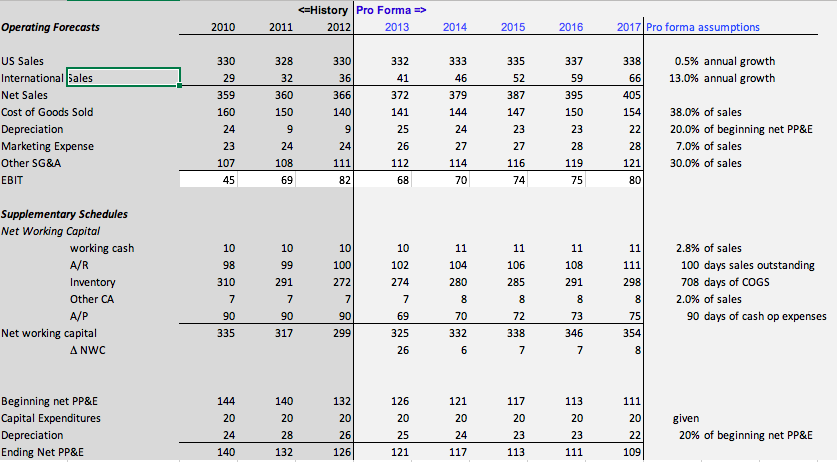
2011 2012 2013 Operating Forecasts 2010 2014 2015 2016 2017 Pro forma assumptions 328 332 337 59 395 0.5% annual growth 13.0% annual growth 41 150 US Sales International Sales Net Sales Cost of Goods Sold Depreciation Marketing Expense Other SG&A EBIT 330 29 359 160 24 23 107 45 32 360 150 9 24 108 69 330 36 366 140 9 24 111 82 372 141 25 26 112 68 333 46 379 144 24 27 114 70 335 52 387 147 23 27 116 74 338 66 405 154 22 28 121 80 23 28 119 38.0% of sales 20.0% of beginning net PP&E 7.0% of sales 30.0% of sales 75 Supplementary Schedules Net Working Capital working cash A/R Inventory Other CA A/P Net working capital ANWC 10 98 310 10 99 291 7 90 10 100 272 7 90 10 102 274 7 69 325 26 11 104 280 8 70 332 6 7 90 11 106 285 8 72 338 7 11 108 291 8 11 111 298 8 75 354 8 2.8% of sales 100 days sales outstanding 708 days of COGS 2.0% of sales 90 days of cash op expenses 335 317 299 73 346 7 Beginning net PP&E Capital Expenditures Depreciation Ending Net PP&E 111 20 144 20 24 140 140 20 28 132 132 20 26 126 126 20 25 121 121 20 24 117 20 23 113 113 20 23 111 given 20% of beginning net PP&E 22 109 117 2011 2012 2013 Operating Forecasts 2010 2014 2015 2016 2017 Pro forma assumptions 328 332 337 59 395 0.5% annual growth 13.0% annual growth 41 150 US Sales International Sales Net Sales Cost of Goods Sold Depreciation Marketing Expense Other SG&A EBIT 330 29 359 160 24 23 107 45 32 360 150 9 24 108 69 330 36 366 140 9 24 111 82 372 141 25 26 112 68 333 46 379 144 24 27 114 70 335 52 387 147 23 27 116 74 338 66 405 154 22 28 121 80 23 28 119 38.0% of sales 20.0% of beginning net PP&E 7.0% of sales 30.0% of sales 75 Supplementary Schedules Net Working Capital working cash A/R Inventory Other CA A/P Net working capital ANWC 10 98 310 10 99 291 7 90 10 100 272 7 90 10 102 274 7 69 325 26 11 104 280 8 70 332 6 7 90 11 106 285 8 72 338 7 11 108 291 8 11 111 298 8 75 354 8 2.8% of sales 100 days sales outstanding 708 days of COGS 2.0% of sales 90 days of cash op expenses 335 317 299 73 346 7 Beginning net PP&E Capital Expenditures Depreciation Ending Net PP&E 111 20 144 20 24 140 140 20 28 132 132 20 26 126 126 20 25 121 121 20 24 117 20 23 113 113 20 23 111 given 20% of beginning net PP&E 22 109 117
Step by Step Solution
There are 3 Steps involved in it

Get step-by-step solutions from verified subject matter experts