

Question: Please fill out chart. THIS IS NOT THE SAME AS SIMILAR CHARTS POSTED, READ THE NUMBERS CAREFULLY. SC$=.5 FOR MY PROBLEM, NOT .25 LIKE IS
Please fill out chart. THIS IS NOT THE SAME AS SIMILAR CHARTS POSTED, READ THE NUMBERS CAREFULLY. SC$=.5 FOR MY PROBLEM, NOT .25 LIKE IS POSTED IN OTHER PROBLEMS.
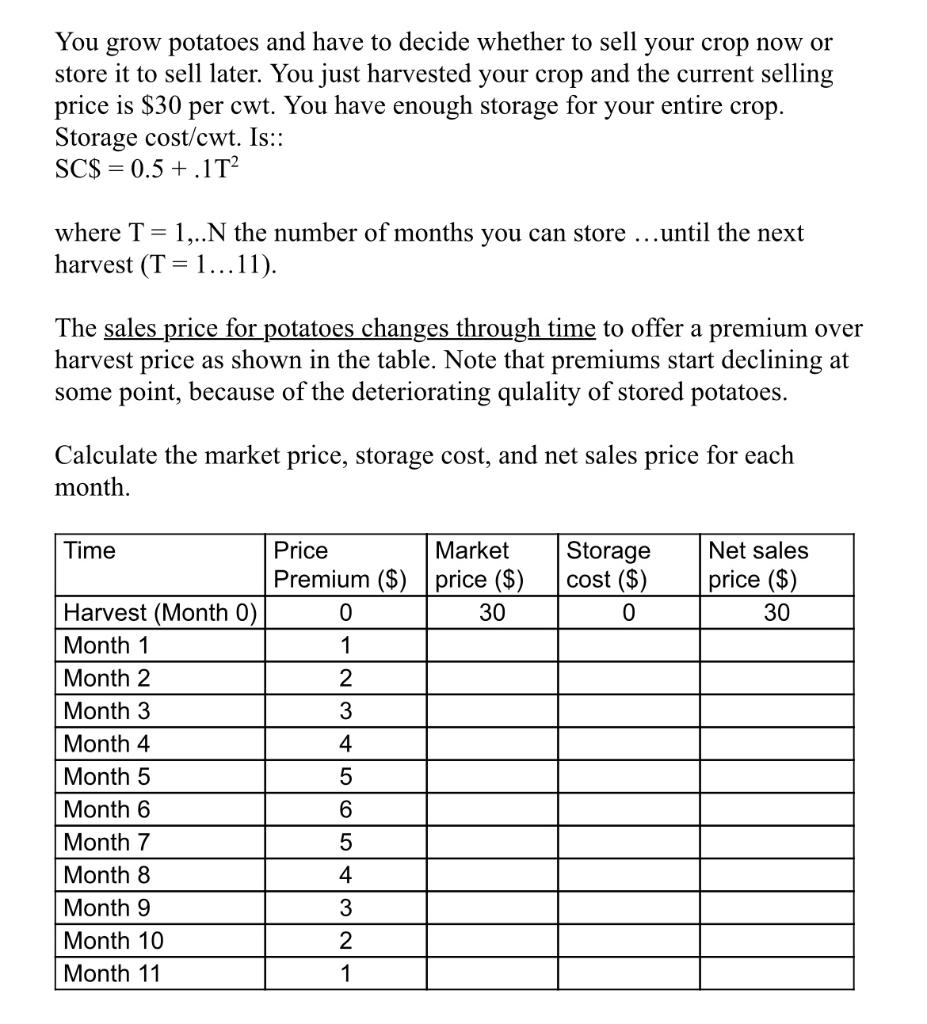
You grow potatoes and have to decide whether to sell your crop now or store it to sell later. You just harvested your crop and the current selling price is $30 per cwt. You have enough storage for your entire crop. Storage cost/cwt. Is:: SC$ = 0.5 +.1T? where T = 1,..N the number of months you can store ... until the next harvest (T = 1...11). = The sales price for potatoes changes through time to offer a premium over harvest price as shown in the table. Note that premiums start declining at some point, because of the deteriorating qulality of stored potatoes. Calculate the market price, storage cost, and net sales price for each month. Time Storage cost ($) 0 Net sales price ($) 30 Price Market Premium ($) price ($) 0 30 1 2 3 4 5 Harvest (Month 0) Month 1 Month 2 Month 3 Month 4 Month 5 Month 6 Month 7 Month Month 9 Month 10 Month 11 6 5 4 3 2 1
Step by Step Solution
There are 3 Steps involved in it

Get step-by-step solutions from verified subject matter experts