

Question: Please fill out projected data for 2015, 2016, 2017, 2018, 2019 with the data provided. Sales COGS (excluding depr.) Gross Profit SG&A R&D Exp. EBITDA
Please fill out projected data for 2015, 2016, 2017, 2018, 2019 with the data provided.
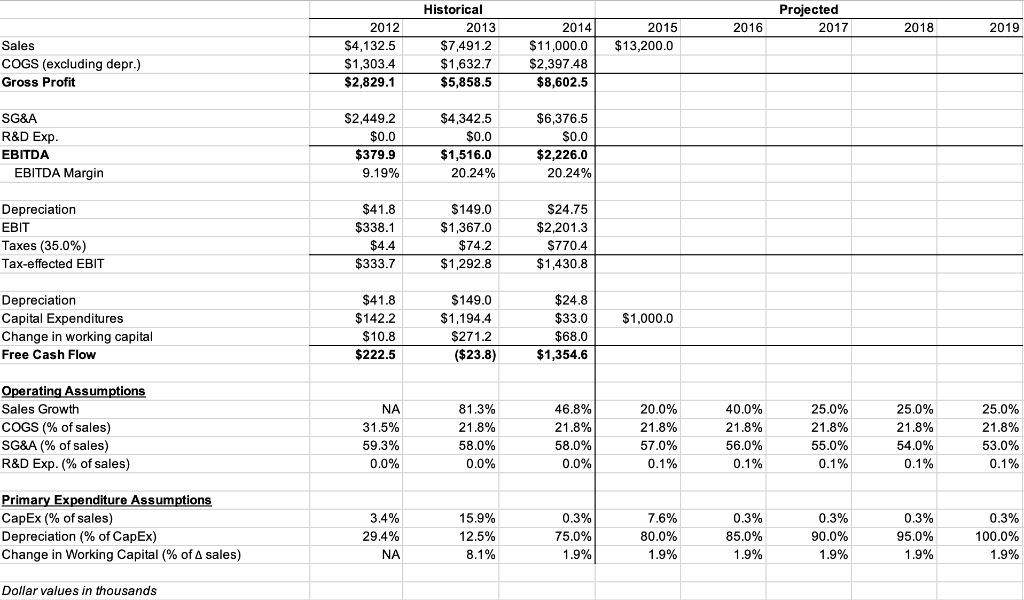
Sales COGS (excluding depr.) Gross Profit SG\&A R\&D Exp. EBITDA EBITDA Margin Depreciation EBIT Taxes (35.0%) Tax-effected EBIT \begin{tabular}{|r|r|r|} \hline$2,449.2 & $4,342.5 & $6,376.5 \\ \hline$0.0 & $0.0 & $0.0 \\ \hline $379.9 & $1,516.0 & $2,226.0 \\ \hline 9.19% & 20.24% & 20.24% \\ \hline \end{tabular} Depreciation Capital Expenditures Change in working capital Free Cash Flow \begin{tabular}{|r|r|r|r|r|r|} \hline$41.8 & $149.0 & $24.75 & \\ \hline$338.1 & $1,367.0 & $2,201.3 & \\ \hline$4.4 & $74.2 & $770.4 & \\ \hline$333.7 & $1,292.8 & $1,430.8 & & \\ \hline & & & & \\ \hline$41.8 & $149.0 & $24.8 & & \\ \hline$142.2 & $1,194.4 & $33.0 & $1,000.0 & \\ \hline$10.8 & $271.2 & $68.0 & & \\ \hline$222.5 & ($23.8 & $1,354.6 & & \\ \hline \end{tabular} Operating Assumptions Sales Growth COGS (\% of sales) SG\&A (\% of sales) R\&D Exp. (\% of sales) Primary Expenditure Assumptions CapEx (\% of sales) Depreciation (\% of CapEx) Change in Working Capital (\% of sales) Dollar values in thousands
Step by Step Solution
There are 3 Steps involved in it

Get step-by-step solutions from verified subject matter experts