

Question: Please fill out table in image thank you 5 . Using Figure ( 1 3 - 1 5 ) , determine the expected
Please fill out table in image thank you
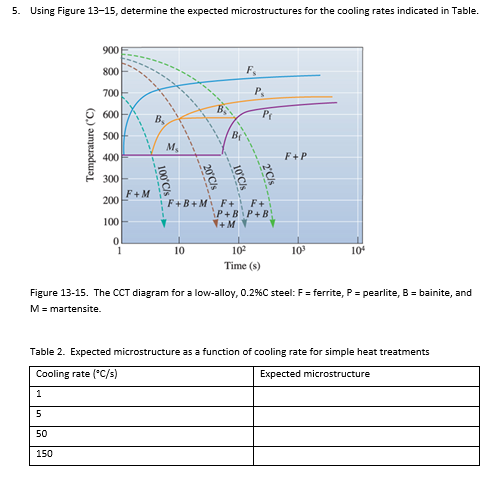
Using Figure determine the expected microstructures for the cooling rates indicated in Table.
Figure The CCT diagram for a lowalloy, mathrmC steel: mathrmF ferrite, mathrmP pearlite, mathrmB bainite, and mathrmM martensite.
Table Expected microstructure as a function of cooling rate for simple heat treatments
Step by Step Solution
There are 3 Steps involved in it
1 Expert Approved Answer
Step: 1 Unlock

Question Has Been Solved by an Expert!
Get step-by-step solutions from verified subject matter experts
Step: 2 Unlock
Step: 3 Unlock