Question: Please fill out the following problem and write work if possible. Handout Problem 4.4 for practice week 1 of chapter 4 In order to demonstrate

Please fill out the following problem and write work if possible. Please fill out the following problem and write

Handout Problem 4.4 for practice week 1 of chapter 4 In order to demonstrate how changing the a 0.1 affects the forecast I have gathered some data from the US Statistical Abstract. Using this data please complete the following: Below is the national student loan debt in the United States. Use the three forecasting methods to assert what the national student load debt is likely to be for 2016 in the exponientally smoothed model please use a smoothing constant of a = 0.1. 3 Month Moving Average Moving Average. = F Exponentially smoothed Forecast dctual - 4 Navedethod , 1 + A + A, ) F = F)+(-1) - F-) Q-01&F, = 5495. Round 3 decimals Absolute Error Period Naive Error At-Ft MA Error At-Ft Exp Error (a=0.1) At-Ft 2006 $500.01 F1 = $495.000 2007 $565.28 2008 $644.94 2009 $733.48 2010 S828.31 2011 $926.88 2012 $1,026.41 2013 $1,118.70 2014 $1,209.25 2015 $1,295.52 Compute student loan debt using each model for 2016? Which method is the best forecasting method? Why do you suppose this is the case? Why does the Moving Average lag the demand? Page 6

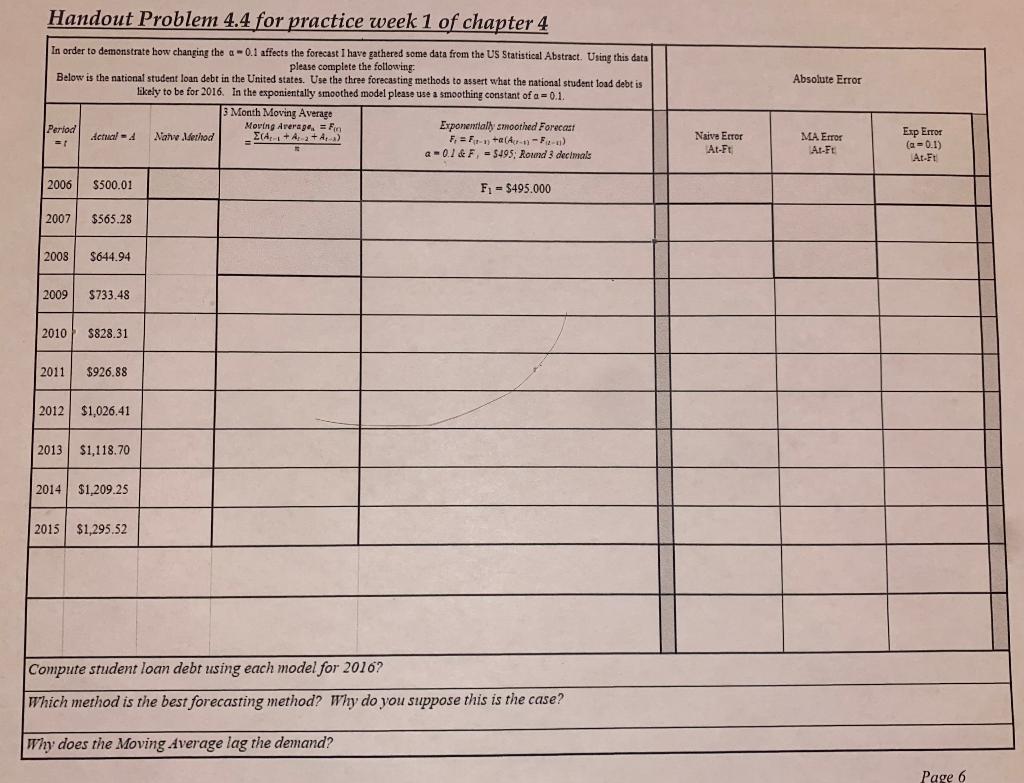
Step by Step Solution

There are 3 Steps involved in it

1 Expert Approved Answer
Step: 1 Unlock blur-text-image
Question Has Been Solved by an Expert!

Get step-by-step solutions from verified subject matter experts

Step: 2 Unlock
Step: 3 Unlock

Students Have Also Explored These Related General Management Questions!