

Question: Please fill out the missing boxes. Thank you Markov analysis attempts to show movement (and non-movement) of employees within and out of an organization from
Please fill out the missing boxes. Thank you
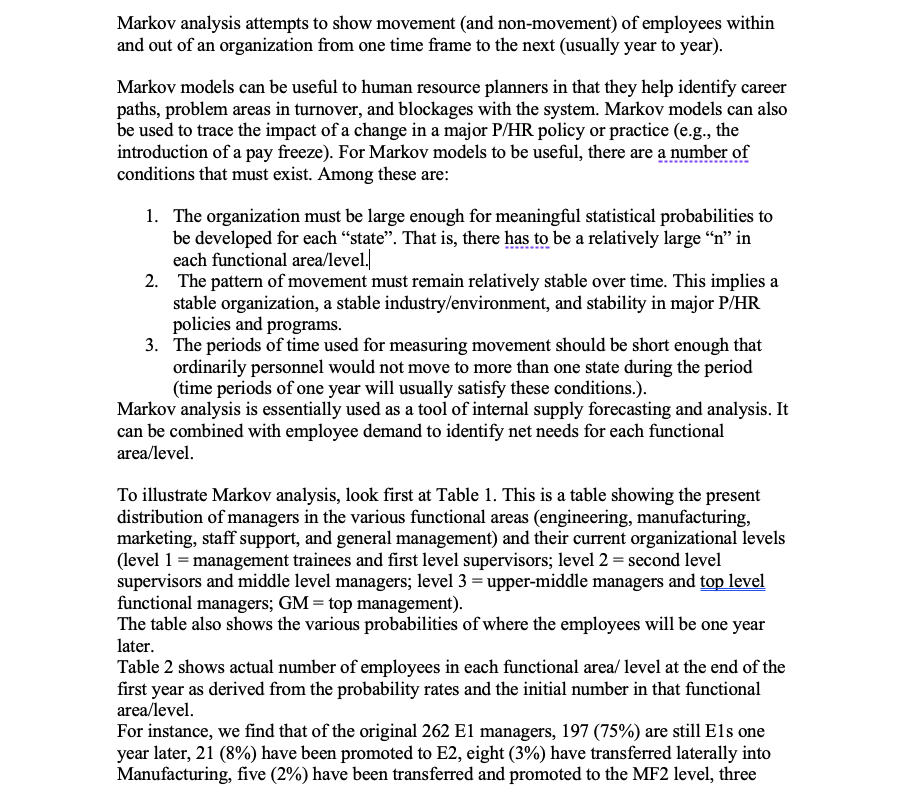
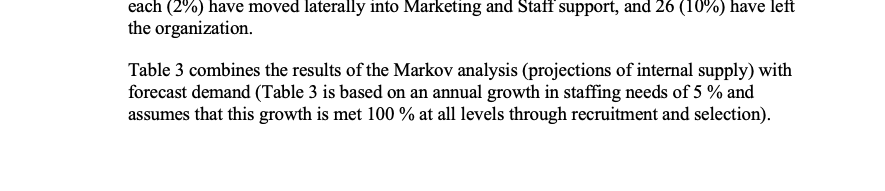
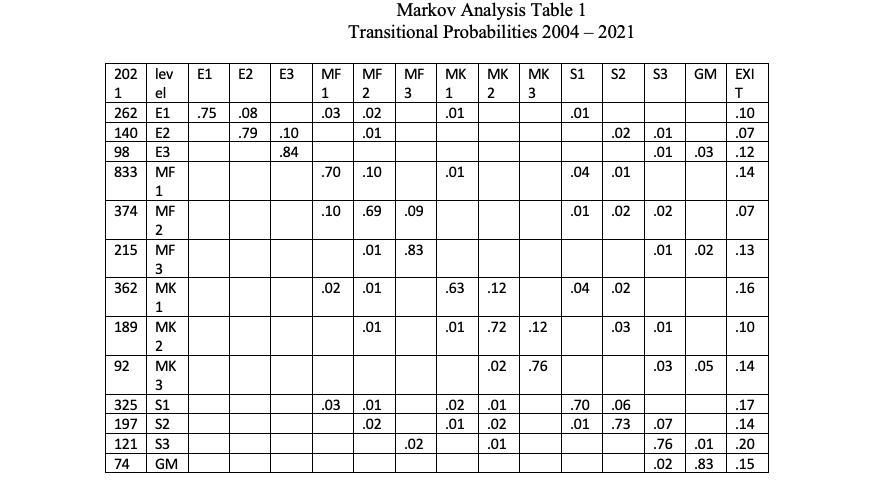
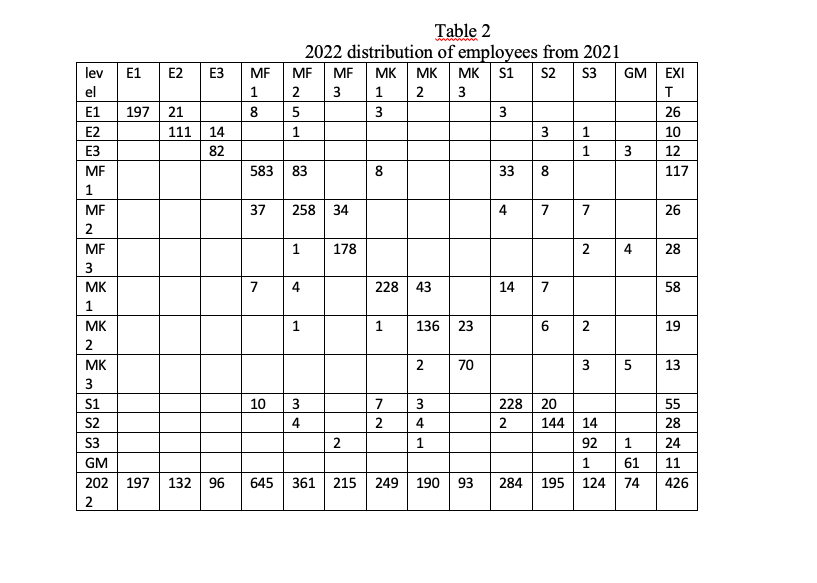
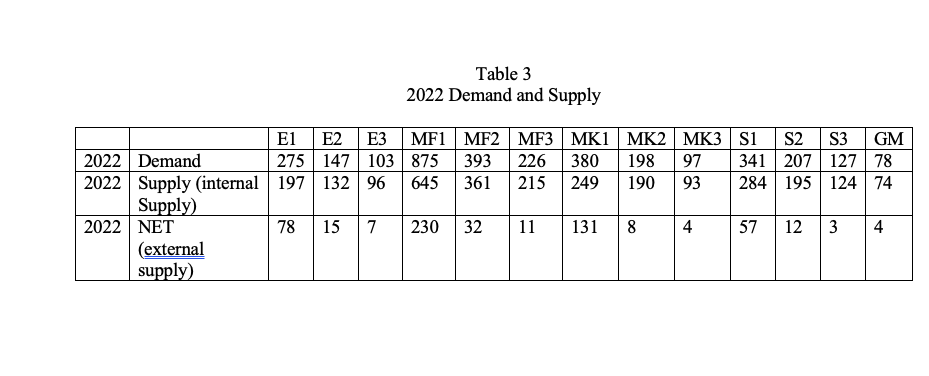
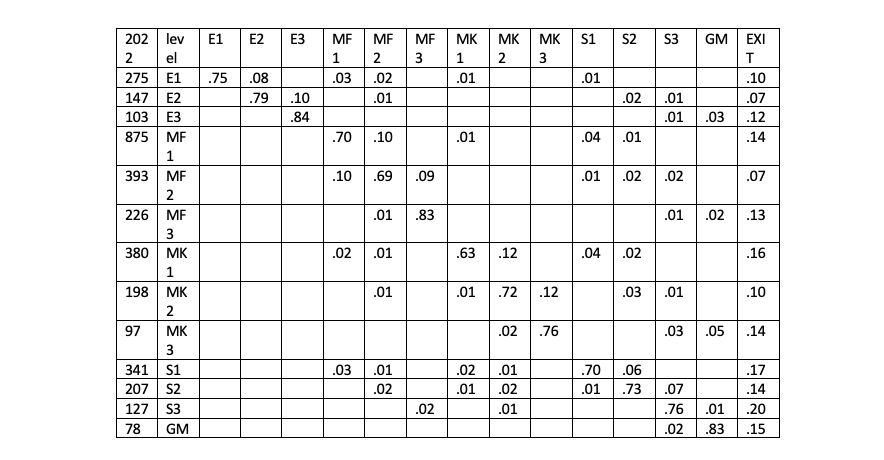
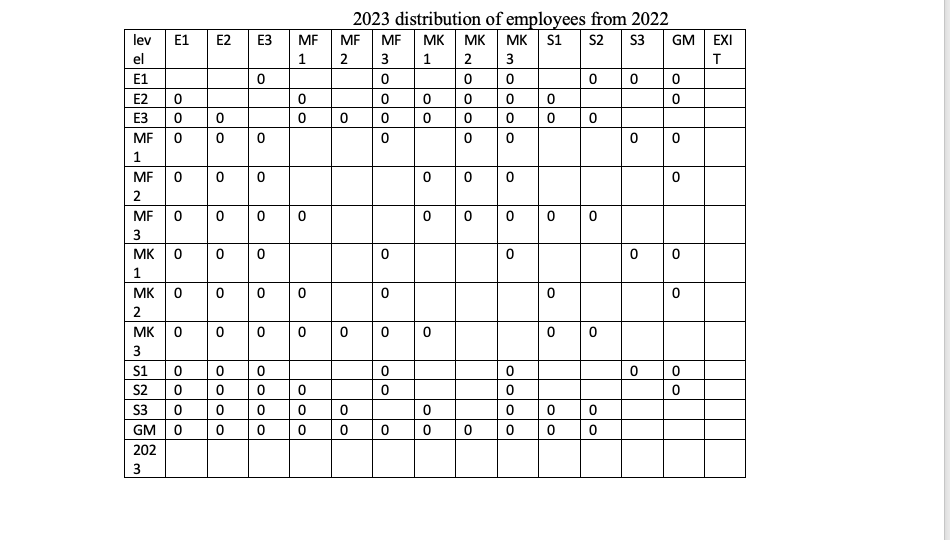
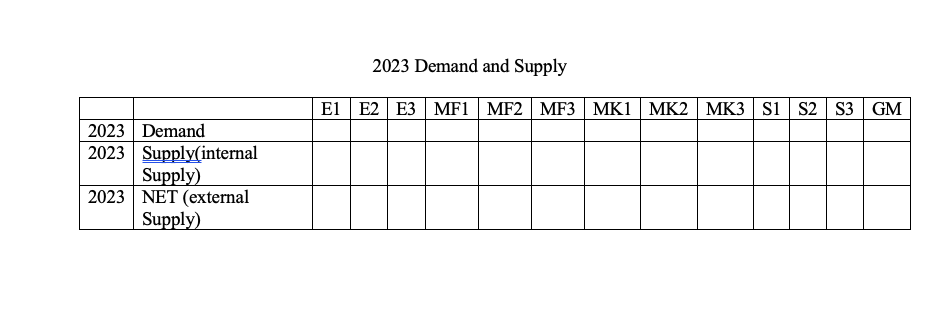
Markov analysis attempts to show movement (and non-movement) of employees within and out of an organization from one time frame to the next (usually year to year). Markov models can be useful to human resource planners in that they help identify career paths, problem areas in turnover, and blockages with the system. Markov models can also be used to trace the impact of a change in a major P/HR policy or practice (e.g., the introduction of a pay freeze). For Markov models to be useful, there are a number of conditions that must exist. Among these are: 1. The organization must be large enough for meaningful statistical probabilities to be developed for each state. That is, there has to be a relatively large n in each functional area/level./ 2. The pattern of movement must remain relatively stable over time. This implies a stable organization, a stable industry/environment, and stability in major P/HR policies and programs. 3. The periods of time used for measuring movement should be short enough that ordinarily personnel would not move to more than one state during the period (time periods of one year will usually satisfy these conditions.). Markov analysis is essentially used as a tool of internal supply forecasting and analysis. It can be combined with employee demand to identify net needs for each functional area/level. To illustrate Markov analysis, look first at Table 1. This is a table showing the present distribution of managers in the various functional areas (engineering, manufacturing, marketing, staff support, and general management) and their current organizational levels (level 1 = management trainees and first level supervisors; level 2 = second level supervisors and middle level managers; level 3 = upper-middle managers and top level functional managers; GM = top management). The table also shows the various probabilities of where the employees will be one year later. Table 2 shows actual number of employees in each functional area/ level at the end of the first year as derived from the probability rates and the initial number in that functional area/level. For instance, we find that of the original 262 El managers, 197 (75%) are still Els one year later, 21 (8%) have been promoted to E2, eight (3%) have transferred laterally into Manufacturing, five (2%) have been transferred and promoted to the MF2 level, three each (2%) have moved laterally into Marketing and Staff support, and 26 (10%) have left the organization. Table 3 combines the results of the Markov analysis (projections of internal supply) with forecast demand (Table 3 is based on an annual growth in staffing needs of 5 % and assumes that this growth is met 100 % at all levels through recruitment and selection). Markov Analysis Table 1 Transitional Probabilities 2004 2021 E1 E2 | E3 S2 S3 MF 1 MF 3 MK | MK | MK | S1 1 2 3 .01 GM | EXI T MF 2 .02 .01 .75 .08 .03 .01 .10 .07 .79 .10 .02 .01 .01 .84 .03 .12 .70 .10 .01 .04 .01 .14 -7020 .10 .69 .09 .01 .02 .02 .07 .01 .83 .01 202 | lev 1 el 262 E1 140 | E2 98 E3 833 | MF 1 374 | MF 2 215 | MF 3 362 | MK 1 189 | MK 2 92 MK 3 325 S1 197 S2 121 S3 74 GM ?.02.13 | .02 .01 .63 .12 .04 .02 .16 .01 .01 .72 .12 .03 .01 .10 .02 .76 .03 .05 .14 .03 .01 .02 .02 .01 .01 .02 .01 .70.06 .01 .73 .17 .14 .07 .76 .02 .01 .20 .02 .83 .15 E1 E2 E3 lev el E1 E2 E3 MF 1 8 Table 2 2022 distribution of employees from 2021 MF MF MKMK MK S1 S2 S3 GM EXI 2 3 1 2 3 T 5 3 3 26 1 3 1 10 1 3 12 83 8 33 8 117 197 21 111 14 82 3 ME 583 00 37 258 34 4 7 7 26 1 178 2 4 28 7 4 228 43 14 7 58 1 1 136 23 6 N 19 1 MF 2 MF 3 MK 1 MK 2 MK 3 S1 S2 S3 GM 202 | 197 13296 2 2. 70 3 3 5 13 10 3 4 7 2 3 4 1 2 228 20 2 144 14 92 1 284 195 124 1 61 74 55 28 24 11 426 645 361215 24919093 Table 3 2022 Demand and Supply 97 E1 E2 E3 MF1 MF2 MF3 MK1 MK2 MK3 si S2 S3 GM 2022 Demand 275 147 103 875 393 226 380 198 341 207 | 12778 2022 Supply (internal 197 132 96 645 361 215 249 190 93 284 | 195 124 74 Supply) 2022 NET 78 15 7 230 32 11 131 8 4 57 12 3 4 (external supply) E1 E2 E3 S1 S2 MF 3 MK 1 .01 MK 2 MF ME 1 2 .03.02 .01 MK 3 .75 .01 .08 .79 S3 GM | EXI T .10 .01 .07 .01.03 .12 .14 .02 .10 .84 .70 .10 .01 .04 .01 .10.69 .09 .01 .02 .02 .07 .01 .83 .01 .02 .13 202 | lev 2 el 275 | E1 147 | E2 103 | E3 875 | MF 1 393 | MF 2 226 | MF 3 380 | MK 1 198 | MK 2 MK 3 341 S1 207 S2 127 83 78 GM .02 .01 .63 .12 .04 .02 .16 .01 .01 .72.12 .03 .01 .10 97 .02.76 .03.05 .14 .03 .01 .17 .01 .02 .02 .01 .70.06 .01 .73 | .02 .01 .02 .07 .76 .01 .02.83 .14 .20 .15 E2 E3 MF MK EXI T N 0 lev E1 el E1 E2 E3 MF 0 1 MFO 2023 distribution of employees from 2022 MF MF MKMK S1 S2 S3 GM 2 3 3 0 0 0 0 0 0 0 0 0 0 0 0 0 0 0 0 ololo olo mlolololo 0 0 ololo Oo O 0 0 0 0 0 0 2. MF 0 0 0 0 0 O B 0 3 MKO 0 0 0 0 0 1 0 0 0 0 0 0 0 O O 0 0 0 0 0 0 0 MK 0 2 MK 0 3 S1 S2 S3 GMO 202 3 0 0 Olo 0 0 olololo olololo Oool 0 0 0 0 Oo 0 o 0 0 0 0 2023 Demand and Supply E1 E2 E3 MF1 MF2 MF3 MK1 MK2 MK3 si S2 S3 GM 2023 Demand 2023 Supply(internal Supply) 2023 NET (external Supply) Markov analysis attempts to show movement (and non-movement) of employees within and out of an organization from one time frame to the next (usually year to year). Markov models can be useful to human resource planners in that they help identify career paths, problem areas in turnover, and blockages with the system. Markov models can also be used to trace the impact of a change in a major P/HR policy or practice (e.g., the introduction of a pay freeze). For Markov models to be useful, there are a number of conditions that must exist. Among these are: 1. The organization must be large enough for meaningful statistical probabilities to be developed for each state. That is, there has to be a relatively large n in each functional area/level./ 2. The pattern of movement must remain relatively stable over time. This implies a stable organization, a stable industry/environment, and stability in major P/HR policies and programs. 3. The periods of time used for measuring movement should be short enough that ordinarily personnel would not move to more than one state during the period (time periods of one year will usually satisfy these conditions.). Markov analysis is essentially used as a tool of internal supply forecasting and analysis. It can be combined with employee demand to identify net needs for each functional area/level. To illustrate Markov analysis, look first at Table 1. This is a table showing the present distribution of managers in the various functional areas (engineering, manufacturing, marketing, staff support, and general management) and their current organizational levels (level 1 = management trainees and first level supervisors; level 2 = second level supervisors and middle level managers; level 3 = upper-middle managers and top level functional managers; GM = top management). The table also shows the various probabilities of where the employees will be one year later. Table 2 shows actual number of employees in each functional area/ level at the end of the first year as derived from the probability rates and the initial number in that functional area/level. For instance, we find that of the original 262 El managers, 197 (75%) are still Els one year later, 21 (8%) have been promoted to E2, eight (3%) have transferred laterally into Manufacturing, five (2%) have been transferred and promoted to the MF2 level, three each (2%) have moved laterally into Marketing and Staff support, and 26 (10%) have left the organization. Table 3 combines the results of the Markov analysis (projections of internal supply) with forecast demand (Table 3 is based on an annual growth in staffing needs of 5 % and assumes that this growth is met 100 % at all levels through recruitment and selection). Markov Analysis Table 1 Transitional Probabilities 2004 2021 E1 E2 | E3 S2 S3 MF 1 MF 3 MK | MK | MK | S1 1 2 3 .01 GM | EXI T MF 2 .02 .01 .75 .08 .03 .01 .10 .07 .79 .10 .02 .01 .01 .84 .03 .12 .70 .10 .01 .04 .01 .14 -7020 .10 .69 .09 .01 .02 .02 .07 .01 .83 .01 202 | lev 1 el 262 E1 140 | E2 98 E3 833 | MF 1 374 | MF 2 215 | MF 3 362 | MK 1 189 | MK 2 92 MK 3 325 S1 197 S2 121 S3 74 GM ?.02.13 | .02 .01 .63 .12 .04 .02 .16 .01 .01 .72 .12 .03 .01 .10 .02 .76 .03 .05 .14 .03 .01 .02 .02 .01 .01 .02 .01 .70.06 .01 .73 .17 .14 .07 .76 .02 .01 .20 .02 .83 .15 E1 E2 E3 lev el E1 E2 E3 MF 1 8 Table 2 2022 distribution of employees from 2021 MF MF MKMK MK S1 S2 S3 GM EXI 2 3 1 2 3 T 5 3 3 26 1 3 1 10 1 3 12 83 8 33 8 117 197 21 111 14 82 3 ME 583 00 37 258 34 4 7 7 26 1 178 2 4 28 7 4 228 43 14 7 58 1 1 136 23 6 N 19 1 MF 2 MF 3 MK 1 MK 2 MK 3 S1 S2 S3 GM 202 | 197 13296 2 2. 70 3 3 5 13 10 3 4 7 2 3 4 1 2 228 20 2 144 14 92 1 284 195 124 1 61 74 55 28 24 11 426 645 361215 24919093 Table 3 2022 Demand and Supply 97 E1 E2 E3 MF1 MF2 MF3 MK1 MK2 MK3 si S2 S3 GM 2022 Demand 275 147 103 875 393 226 380 198 341 207 | 12778 2022 Supply (internal 197 132 96 645 361 215 249 190 93 284 | 195 124 74 Supply) 2022 NET 78 15 7 230 32 11 131 8 4 57 12 3 4 (external supply) E1 E2 E3 S1 S2 MF 3 MK 1 .01 MK 2 MF ME 1 2 .03.02 .01 MK 3 .75 .01 .08 .79 S3 GM | EXI T .10 .01 .07 .01.03 .12 .14 .02 .10 .84 .70 .10 .01 .04 .01 .10.69 .09 .01 .02 .02 .07 .01 .83 .01 .02 .13 202 | lev 2 el 275 | E1 147 | E2 103 | E3 875 | MF 1 393 | MF 2 226 | MF 3 380 | MK 1 198 | MK 2 MK 3 341 S1 207 S2 127 83 78 GM .02 .01 .63 .12 .04 .02 .16 .01 .01 .72.12 .03 .01 .10 97 .02.76 .03.05 .14 .03 .01 .17 .01 .02 .02 .01 .70.06 .01 .73 | .02 .01 .02 .07 .76 .01 .02.83 .14 .20 .15 E2 E3 MF MK EXI T N 0 lev E1 el E1 E2 E3 MF 0 1 MFO 2023 distribution of employees from 2022 MF MF MKMK S1 S2 S3 GM 2 3 3 0 0 0 0 0 0 0 0 0 0 0 0 0 0 0 0 ololo olo mlolololo 0 0 ololo Oo O 0 0 0 0 0 0 2. MF 0 0 0 0 0 O B 0 3 MKO 0 0 0 0 0 1 0 0 0 0 0 0 0 O O 0 0 0 0 0 0 0 MK 0 2 MK 0 3 S1 S2 S3 GMO 202 3 0 0 Olo 0 0 olololo olololo Oool 0 0 0 0 Oo 0 o 0 0 0 0 2023 Demand and Supply E1 E2 E3 MF1 MF2 MF3 MK1 MK2 MK3 si S2 S3 GM 2023 Demand 2023 Supply(internal Supply) 2023 NET (external Supply)
Step by Step Solution
There are 3 Steps involved in it

Get step-by-step solutions from verified subject matter experts