

Question: Please fill the blank in using Chipotle 2017, 2018, 2019 Financial Statements. PROFITABILITY ANALYSIS Profitability is arguably the most important concern for businesses. As a
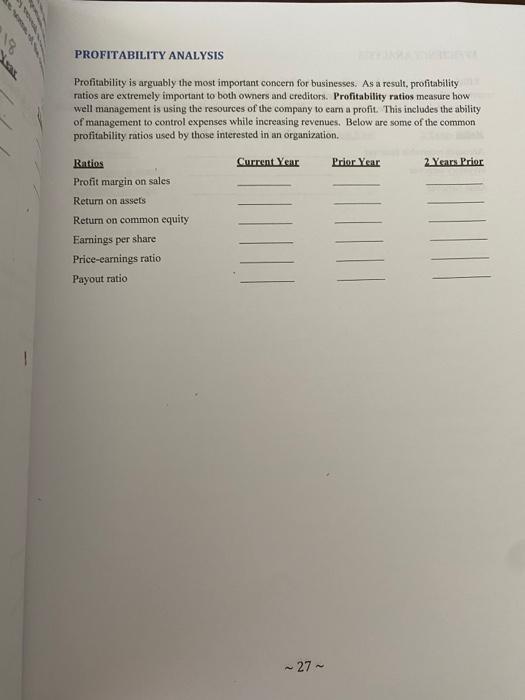
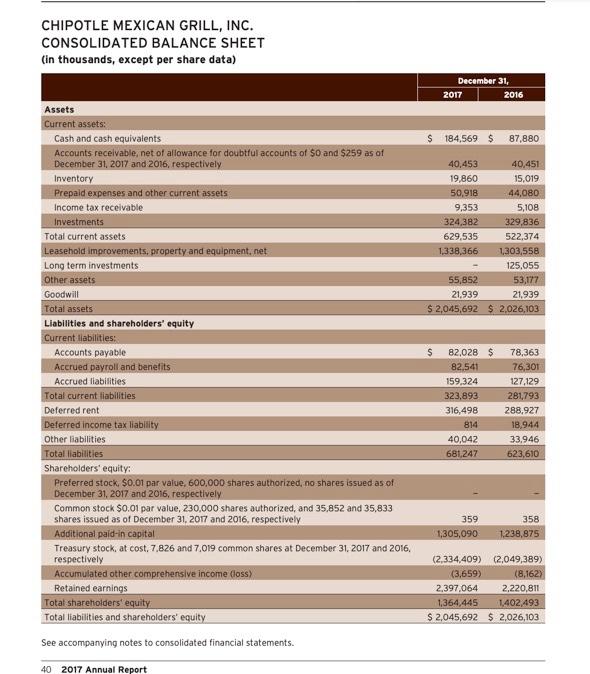
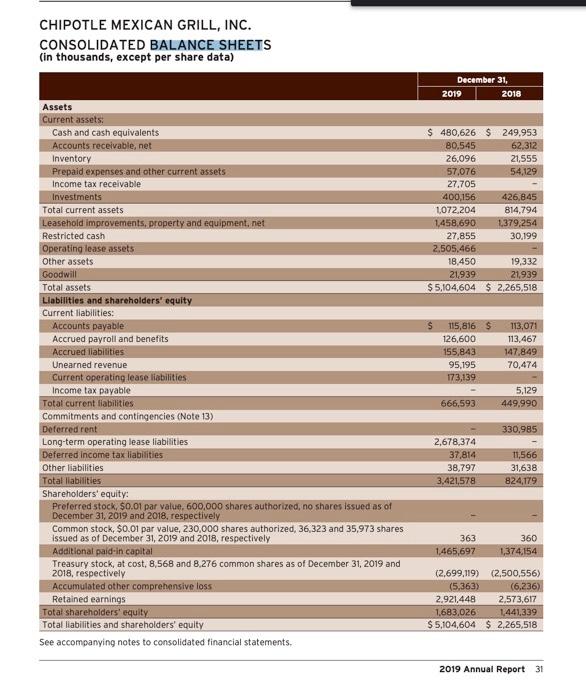
PROFITABILITY ANALYSIS Profitability is arguably the most important concern for businesses. As a result, profitability ratios are extremely important to both owners and creditors. Profitability ratios measure how well management is using the resources of the company to earn a profit . This includes the ability of management to control expenses while increasing revenues. Below are some of the common profitability ratios used by those interested in an organization Current Year Prior Year 2 Years Prior Ratios Profit margin on sales Return on assets Return on common equity Earnings per share Price-earnings ratio Payout ratio ~ 27 ~ CHIPOTLE MEXICAN GRILL, INC. CONSOLIDATED BALANCE SHEET (in thousands, except per share data) December 31, 2017 2016 $ 184,569 $ 87,880 40,453 40,451 19,860 15,019 50,918 44,080 9,353 5,108 324,382 329,836 629,535 522,374 1,338,366 1303,558 125,055 55,852 53,177 21.939 21,939 $ 2,045,692 $ 2,026,103 $ Assets Current assets: Cash and cash equivalents Accounts receivable, net of allowance for doubtful accounts of $0 and $259 as of December 31, 2017 and 2016, respectively Inventory Prepaid expenses and other current assets Income tax receivable Investments Total current assets Leasehold improvements, property and equipment, net Long term investments Other assets Goodwill Total assets Liabilities and shareholders' equity Current liabilities: Accounts payable Accrued payroll and benefits Accrued liabilities Total current liabilities Deferred rent Deferred income tax liability Other liabilities Total liabilities Shareholders' equity: Preferred stock. $0.01 par value, 600,000 shares authorized, no shares issued as of December 31, 2017 and 2016, respectively Common stock $0.01 par value, 230,000 shares authorized, and 35,852 and 35,833 shares issued as of December 31, 2017 and 2016, respectively Additional paid-in capital Treasury stock, at cost. 7,826 and 7,019 common shares at December 31, 2017 and 2016. respectively Accumulated other comprehensive income Gloss) Retained earnings Total shareholders'equity Total liabilities and shareholders' equity See accompanying notes to consolidated financial statements. 82,028 $ 82,541 159,324 323,893 316,498 814 40,042 681.247 78,363 76,301 127,129 281,793 288.927 18,944 33.946 623,610 359 1,305,090 358 1.238,875 (2,334,409) (2,049,389) (3,659) (8,162) 2,397,064 2.220,811 1,364,445 1.402,493 $ 2,045,692 $ 2,026,103 40 2017 Annual Report CHIPOTLE MEXICAN GRILL, INC. CONSOLIDATED BALANCE SHEETS (in thousands, except per share data) December 31, 2019 2018 $ 480,626 $ 249,953 80,545 62,312 26,096 21,555 57,076 54,129 27.705 400,156 426,845 1,072,204 814,794 1,458,690 1.379,254 27.855 30,199 2,505,466 18,450 19,332 21.939 21,939 $5,104,604 $ 2,265,518 S Assets Current assets: Cash and cash equivalents Accounts receivable, net Inventory Prepaid expenses and other current assets Income tax receivable Investments Total current assets Leasehold improvements, property and equipment, net Restricted cash Operating lease assets Other assets Goodwill Total assets Liabilities and shareholders' equity Current liabilities: Accounts payable Accrued payroll and benefits Accrued liabilities Unearned revenue Current operating lease liabilities Income tax payable Total current liabilities Commitments and contingencies (Note 13) Deferred rent Long-term operating lease liabilities Deferred Income tax liabilities Other liabilities Total liabilities Shareholders' equity: Preferred stock. $0.01 par value, 600,000 shares authorized, no shares issued as of December 31, 2019 and 2018, respectively Common stock, $0.01 par value, 230,000 shares authorized, 36,323 and 35,973 shares issued as of December 31, 2019 and 2018, respectively Additional paid in capital Treasury stock, at cost, 8,568 and 8.276 common shares as of December 31, 2019 and 2018, respectively Accumulated other comprehensive loss Retained earnings Total shareholders' equity Total liabilities and shareholders' equity See accompanying notes to consolidated financial statements. 115,816 $ 126,600 155,843 95,195 173,139 113,071 113,467 147.849 70,474 5,129 449.990 666,593 330,985 2,678,374 37,814 38,797 3,421,578 11,566 31,638 824,179 363 1,465,697 360 1,374.154 (2.699,119) (2,500,556) (5,363) (6.236) 2.921,448 2.573.617 1.683,026 1,441,339 $ 5,104,604 $2,265,518 2019 Annual Report 31
Step by Step Solution
There are 3 Steps involved in it

Get step-by-step solutions from verified subject matter experts