

Question: please fill the Excel sheet with the provided information and give formula/steps. The Six-Month Merchandise Plan/Budget ( 50 points) is a guide that is used
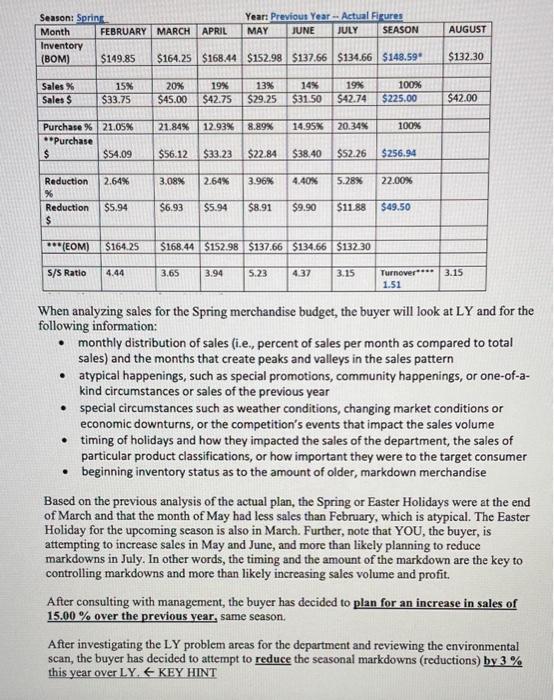
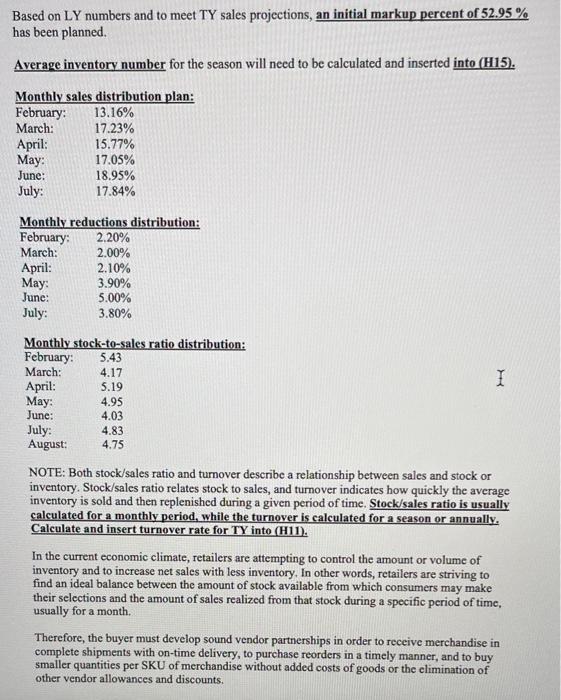
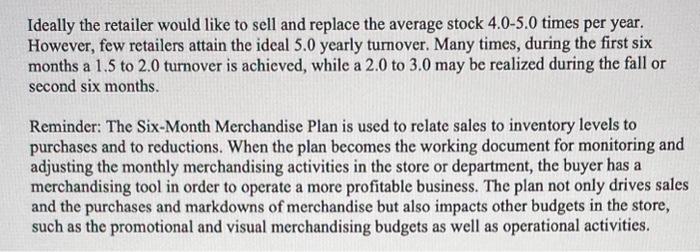
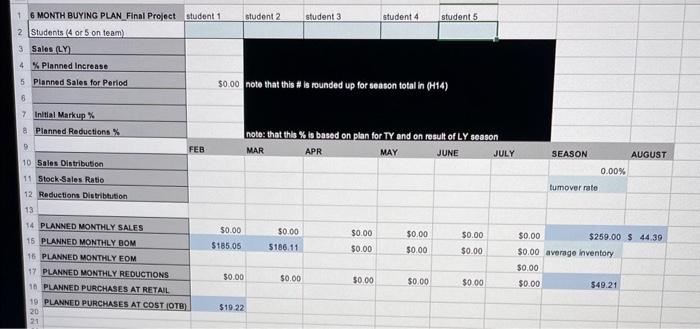
The Six-Month Merchandise Plan/Budget ( 50 points) is a guide that is used by the buyer in order to attempt to operate a profitable business. The plan relates the sales volume to the stock levels, provides a guideline for markdowns, and denotes the planned purchases needed for the plan to work. IMPORTANT: WHEN YOU ENTER NUMBERS INTO YOUR EXCEL SPREADSHEET: For the Six-Month Merchandise Plan all figures in the actual plan are rounded according to financial notations. For example, the decimal point is always between the thousand- and hundred-dollar amounts; therefore $203,856.45 is written on the excel six-month merchandise plan as $203.86. Below is last year's Spring 6-month merchandise plan. You will need parts of it and the information contained within the document to complete/answer the questions completely. When analyzing sales for the Spring merchandise budget, the buyer will look at LY and for the following information: - monthly distribution of sales (i.e., percent of sales per month as compared to total sales) and the months that create peaks and valleys in the sales pattern - atypical happenings, such as special promotions, community happenings, or one-of-akind circumstances or sales of the previous year - special circumstances such as weather conditions, changing market conditions or economic downturns, or the competition's events that impact the sales volume - timing of holidays and how they impacted the sales of the department, the sales of particular product classifications, or how important they were to the target consumer - beginning inventory status as to the amount of older, markdown merchandise Based on the previous analysis of the actual plan, the Spring or Easter Holidays were at the end of March and that the month of May had less sales than February, which is atypical. The Easter Holiday for the upcoming season is also in March. Further, note that YOU, the buyer, is attempting to increase sales in May and June, and more than likely planning to reduce markdowns in July. In other words, the timing and the amount of the markdown are the key to controlling markdowns and more than likely increasing sales volume and profit. Based on LY numbers and to meet TY sales projections, an initial markup percent of 52.95% has been planned. Average inventory number for the season will need to be calculated and inserted into (H15). NOTE: Both stock/sales ratio and turnover describe a relationship between sales and stock or inventory. Stock/sales ratio relates stock to sales, and turnover indicates how quickly the average inventory is sold and then replenished during a given period of time. Stock/sales ratio is usually calculated for a monthly period, while the turnover is calculated for a season or annually. Calculate and insert turnover rate for TY into (H11). In the current economic climate, retailers are attempting to control the amount or volume of inventory and to increase net sales with less inventory. In other words, retailers are striving to find an ideal balance between the amount of stock available from which consumers may make their selections and the amount of sales realized from that stock during a specific period of time, usually for a month. Therefore, the buyer must develop sound vendor partnerships in order to receive merchandise in complete shipments with on-time delivery, to purchase reorders in a timely manner, and to buy smaller quantities per SKU of merchandise without added costs of goods or the elimination of other vendor allowances and discounts. Ideally the retailer would like to sell and replace the average stock 4.05.0 times per year. However, few retailers attain the ideal 5.0 yearly tumover. Many times, during the first six months a 1.5 to 2.0 turnover is achieved, while a 2.0 to 3.0 may be realized during the fall or second six months. Reminder: The Six-Month Merchandise Plan is used to relate sales to inventory levels to purchases and to reductions. When the plan becomes the working document for monitoring and adjusting the monthly merchandising activities in the store or department, the buyer has a merchandising tool in order to operate a more profitable business. The plan not only drives sales and the purchases and markdowns of merchandise but also impacts other budgets in the store, such as the promotional and visual merchandising budgets as well as operational activities. The Six-Month Merchandise Plan/Budget ( 50 points) is a guide that is used by the buyer in order to attempt to operate a profitable business. The plan relates the sales volume to the stock levels, provides a guideline for markdowns, and denotes the planned purchases needed for the plan to work. IMPORTANT: WHEN YOU ENTER NUMBERS INTO YOUR EXCEL SPREADSHEET: For the Six-Month Merchandise Plan all figures in the actual plan are rounded according to financial notations. For example, the decimal point is always between the thousand- and hundred-dollar amounts; therefore $203,856.45 is written on the excel six-month merchandise plan as $203.86. Below is last year's Spring 6-month merchandise plan. You will need parts of it and the information contained within the document to complete/answer the questions completely. When analyzing sales for the Spring merchandise budget, the buyer will look at LY and for the following information: - monthly distribution of sales (i.e., percent of sales per month as compared to total sales) and the months that create peaks and valleys in the sales pattern - atypical happenings, such as special promotions, community happenings, or one-of-akind circumstances or sales of the previous year - special circumstances such as weather conditions, changing market conditions or economic downturns, or the competition's events that impact the sales volume - timing of holidays and how they impacted the sales of the department, the sales of particular product classifications, or how important they were to the target consumer - beginning inventory status as to the amount of older, markdown merchandise Based on the previous analysis of the actual plan, the Spring or Easter Holidays were at the end of March and that the month of May had less sales than February, which is atypical. The Easter Holiday for the upcoming season is also in March. Further, note that YOU, the buyer, is attempting to increase sales in May and June, and more than likely planning to reduce markdowns in July. In other words, the timing and the amount of the markdown are the key to controlling markdowns and more than likely increasing sales volume and profit. Based on LY numbers and to meet TY sales projections, an initial markup percent of 52.95% has been planned. Average inventory number for the season will need to be calculated and inserted into (H15). NOTE: Both stock/sales ratio and turnover describe a relationship between sales and stock or inventory. Stock/sales ratio relates stock to sales, and turnover indicates how quickly the average inventory is sold and then replenished during a given period of time. Stock/sales ratio is usually calculated for a monthly period, while the turnover is calculated for a season or annually. Calculate and insert turnover rate for TY into (H11). In the current economic climate, retailers are attempting to control the amount or volume of inventory and to increase net sales with less inventory. In other words, retailers are striving to find an ideal balance between the amount of stock available from which consumers may make their selections and the amount of sales realized from that stock during a specific period of time, usually for a month. Therefore, the buyer must develop sound vendor partnerships in order to receive merchandise in complete shipments with on-time delivery, to purchase reorders in a timely manner, and to buy smaller quantities per SKU of merchandise without added costs of goods or the elimination of other vendor allowances and discounts. Ideally the retailer would like to sell and replace the average stock 4.05.0 times per year. However, few retailers attain the ideal 5.0 yearly tumover. Many times, during the first six months a 1.5 to 2.0 turnover is achieved, while a 2.0 to 3.0 may be realized during the fall or second six months. Reminder: The Six-Month Merchandise Plan is used to relate sales to inventory levels to purchases and to reductions. When the plan becomes the working document for monitoring and adjusting the monthly merchandising activities in the store or department, the buyer has a merchandising tool in order to operate a more profitable business. The plan not only drives sales and the purchases and markdowns of merchandise but also impacts other budgets in the store, such as the promotional and visual merchandising budgets as well as operational activities
Step by Step Solution
There are 3 Steps involved in it

Get step-by-step solutions from verified subject matter experts