

Question: Please Fill The Table B D E F G H | J K L M N o P 0 1 Statement of Financial Position CHAN
Please Fill The Table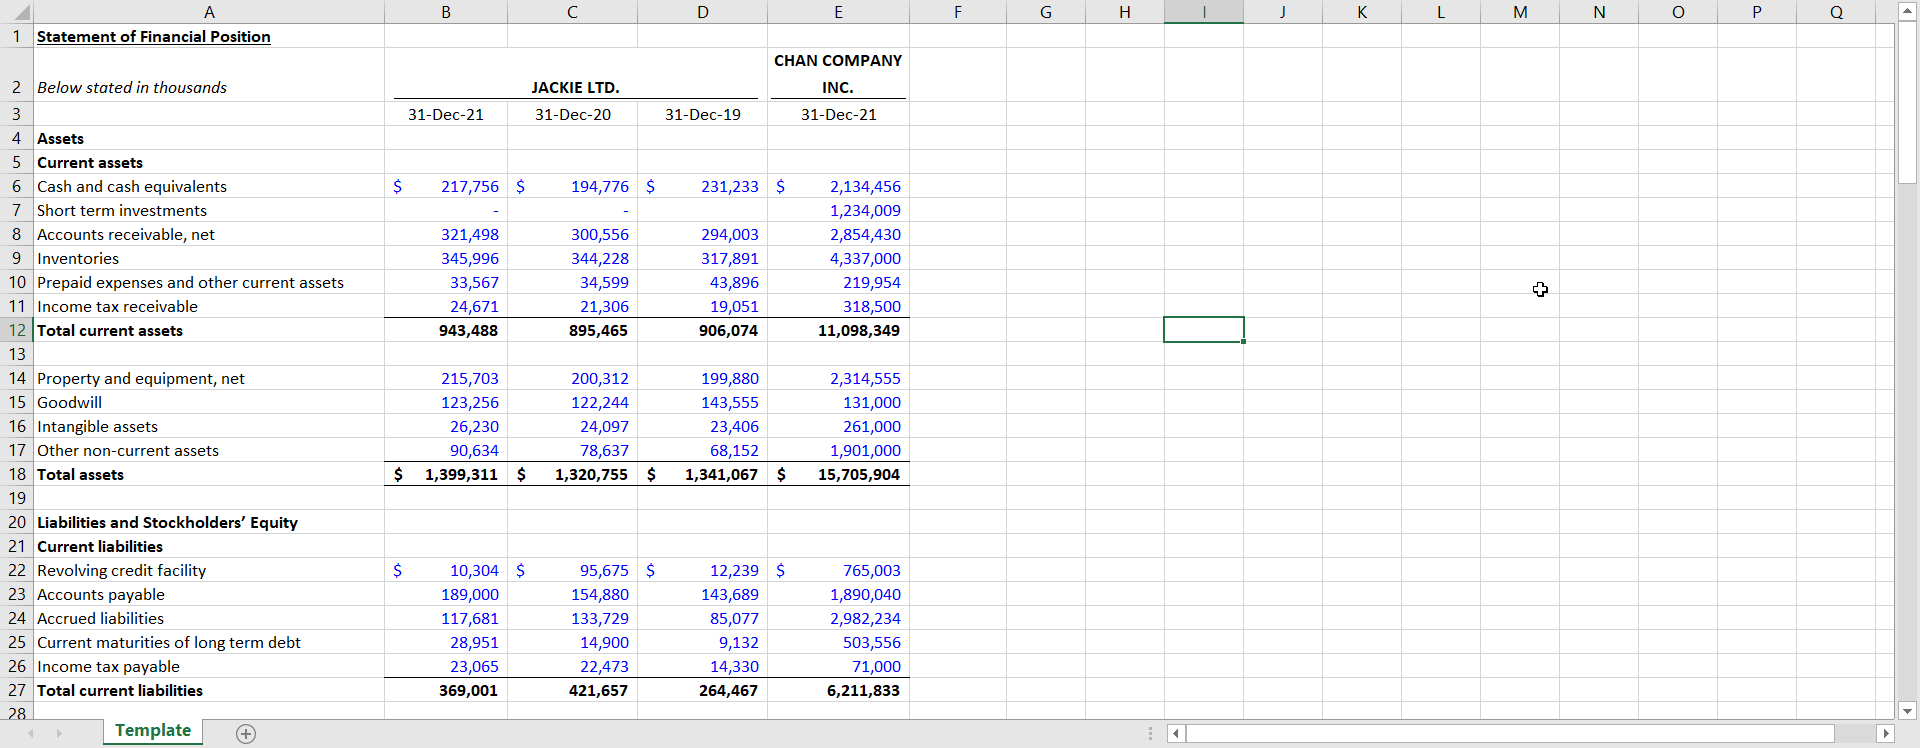
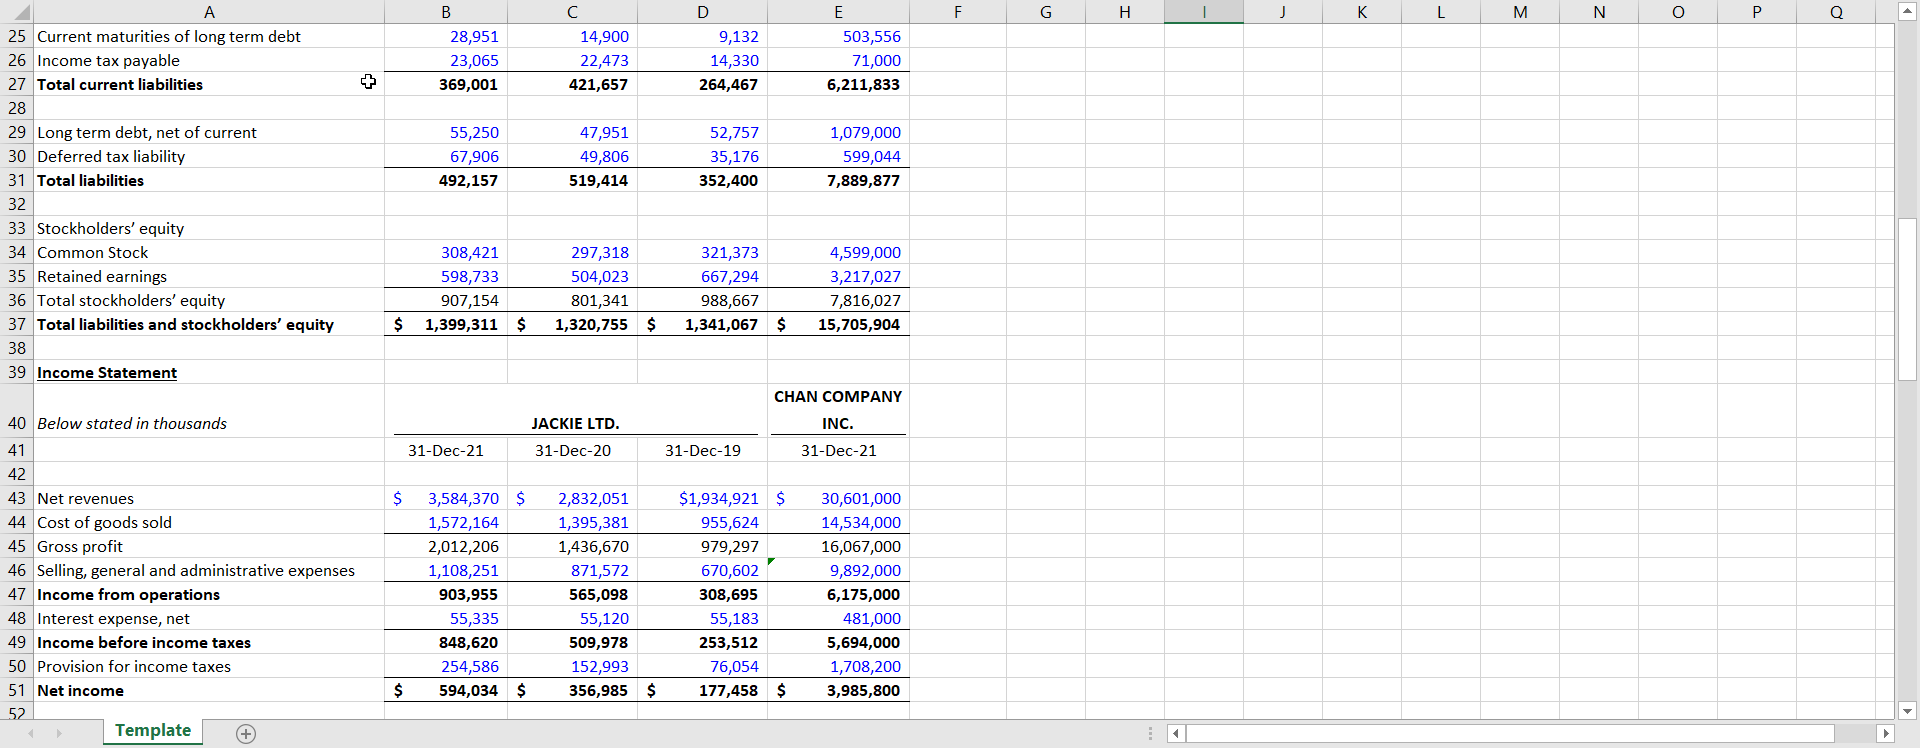
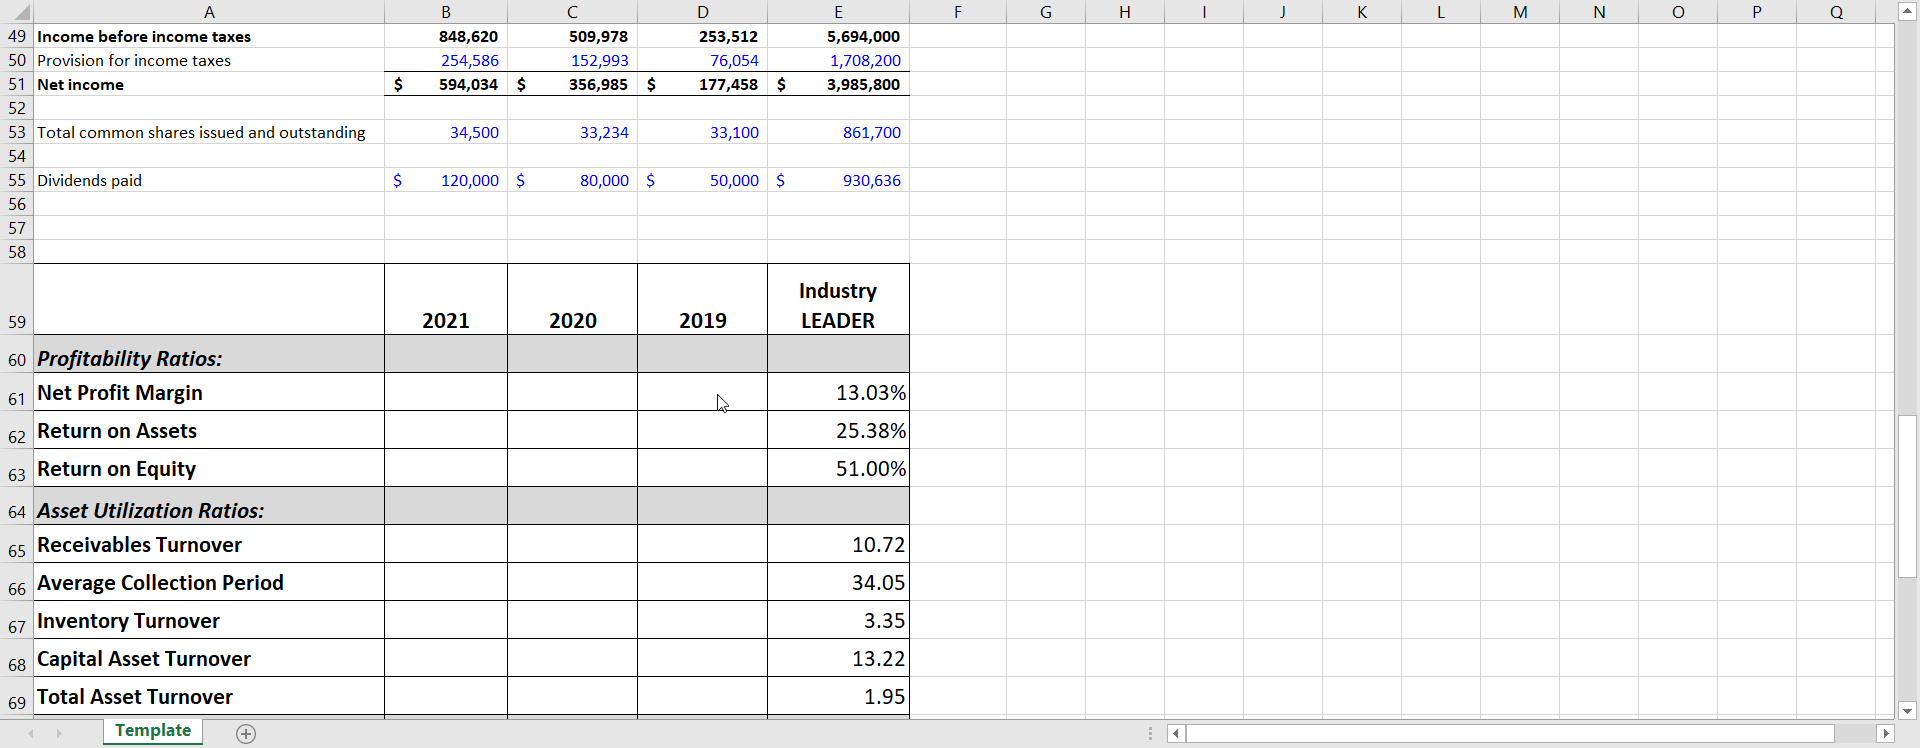
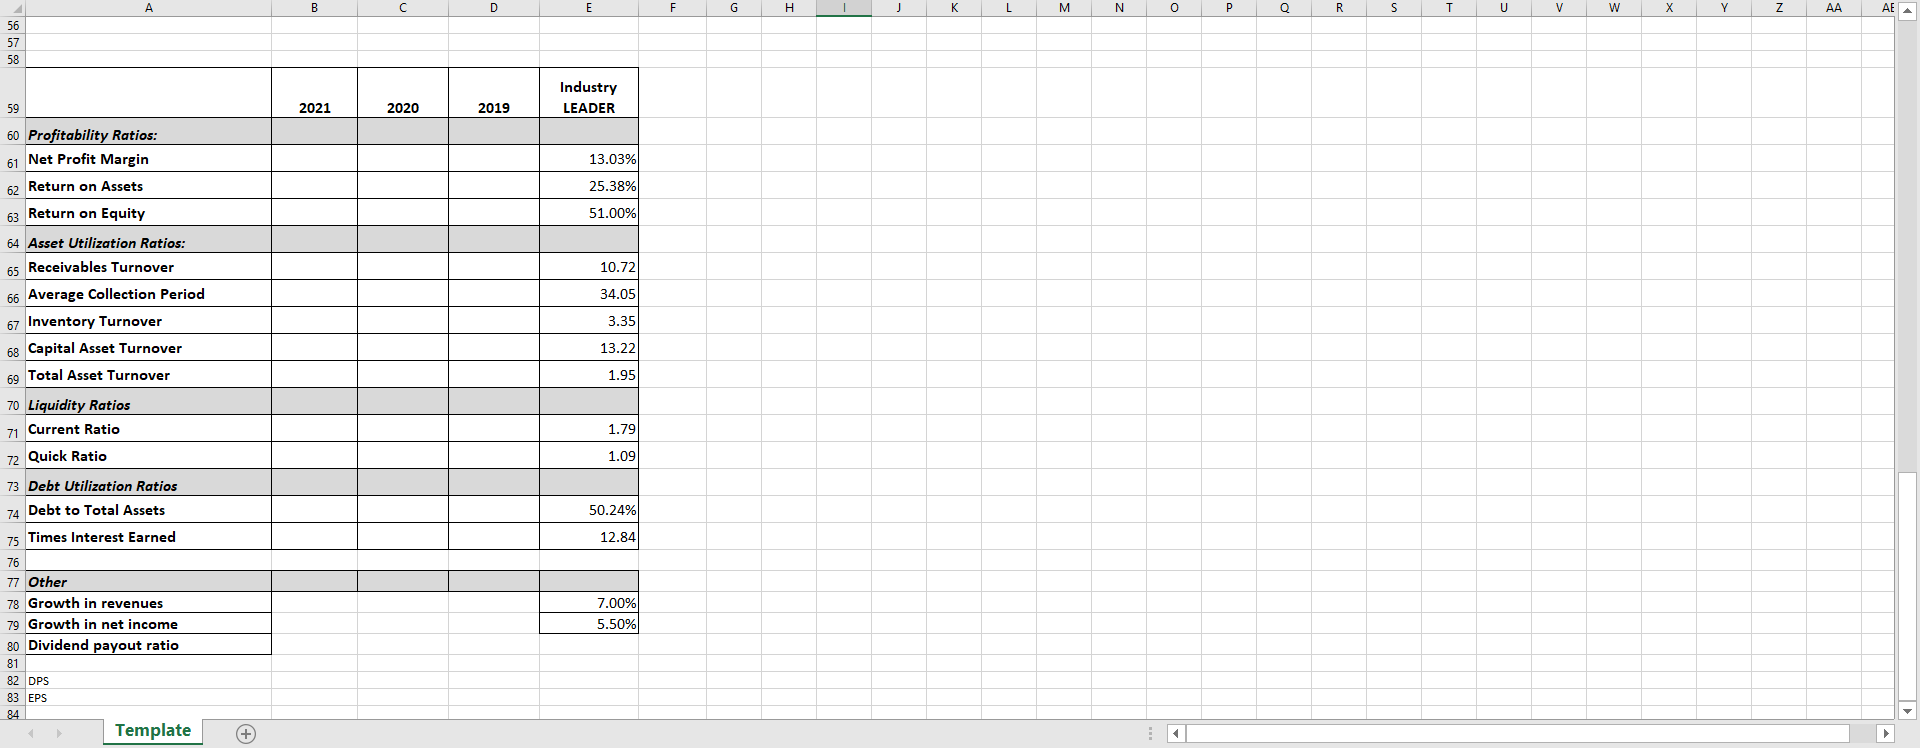
B D E F G H | J K L M N o P 0 1 Statement of Financial Position CHAN COMPANY 2 Below stated in thousands INC. JACKIE LTD. 31-Dec-20 31-Dec-21 31-Dec-19 31-Dec-21 $ 217,756 $ 194,776 $ 231,233 $ 321,498 345,996 33,567 24,671 943,488 300,556 344,228 34,599 21,306 895,465 294,003 317,891 43,896 19,051 906,074 2,134,456 1,234,009 2,854,430 4,337,000 219,954 318,500 11,098,349 3 4 Assets 5 Current assets 6 Cash and cash equivalents 7 Short term investments 8 Accounts receivable, net 9 Inventories 10 Prepaid expenses and other current assets 11 Income tax receivable 12 Total current assets 13 14 Property and equipment, net 15 Goodwill 16 Intangible assets 17 Other non-current assets 18 Total assets 19 20 Liabilities and Stockholders' Equity 21 Current liabilities 22 Revolving credit facility 23 Accounts payable 24 Accrued liabilities 25 Current maturities of long term debt 26 Income tax payable 27 Total current liabilities 28 Template 215,703 123,256 26,230 90,634 1,399,311 200,312 122,244 24,097 78,637 1,320,755 $ 199,880 143,555 23,406 68,152 1,341,067 $ 2,314,555 131,000 261,000 1,901,000 15,705,904 $ $ $ 10,304 $ 189,000 117,681 28,951 23,065 369,001 95,675 $ 154,880 133,729 14,900 22,473 421,657 12,239 $ 143,689 85,077 9,132 14,330 264,467 765,003 1,890,040 2,982,234 503,556 71,000 6,211,833 D F G H | J K L M N O Q B 28,951 23,065 369,001 14,900 22,473 421,657 9,132 14,330 264,467 E 503,556 71,000 6,211,833 55,250 67,906 492,157 47,951 49,806 519,414 52,757 35,176 352,400 1,079,000 599,044 7,889,877 25 Current maturities of long term debt 26 Income tax payable 27 Total current liabilities 28 29 Long term debt, net of current 30 Deferred tax liability 31 Total liabilities 32 33 Stockholders' equity 34 Common Stock 35 Retained earnings 36 Total stockholders' equity 37 Total liabilities and stockholders' equity 38 39 Income Statement 308,421 598,733 907,154 1,399,311 $ 297,318 504,023 801,341 1,320,755 $ 321,373 667,294 988,667 1,341,067 $ 4,599,000 3,217,027 7,816,027 15,705,904 $ CHAN COMPANY JACKIE LTD. INC. 31-Dec-21 31-Dec-20 31-Dec-19 31-Dec-21 $ 40 Below stated in thousands 41 42 43 Net revenues 44 Cost of goods sold 45 Gross profit 46 Selling, general and administrative expenses 47 Income from operations 48 Interest expense, net 49 Income before income taxes 50 Provision for income taxes 51 Net income 52 Template 3,584,370 $ 1,572,164 2,012,206 1,108,251 903,955 55,335 848,620 254,586 594,034 $ 2,832,051 1,395,381 1,436,670 871,572 565,098 55,120 509,978 152,993 356,985 $1,934,921 $ 955,624 979,297 670,602 308,695 55,183 253,512 76,054 177,458 $ 30,601,000 14,534,000 16,067,000 9,892,000 6,175,000 481,000 5,694,000 1,708,200 3,985,800 $ $ B D F G H - J K L M N O Q 848,620 254,586 594,034 $ 509,978 152,993 356,985 $ 253,512 76,054 177,458 $ E 5,694,000 1,708,200 3,985,800 $ 34,500 33,234 33,100 861,700 49 Income before income taxes 50 Provision for income taxes 51 Net income 52 53 Total common shares issued and outstanding 54 55 Dividends paid 56 57 58 $ 120,000 $ 80,000 $ 50,000 $ 930,636 Industry LEADER 59 2021 2020 2019 13.03% 60 Profitability Ratios: 61 Net Profit Margin 62 Return on Assets 63 Return on Equity 25.38% 51.00% 64 Asset Utilization Ratios: 10.72 34.05 3.35 65 Receivables Turnover 66 Average Collection Period 67 Inventory Turnover 68 Capital Asset Turnover 69 Total Asset Turnover Template 13.22 1.95 A B D E F G H J K L M N O P Q R S T U V Y Z AA AE A 56 57 58 Industry LEADER 59 2021 2020 2019 13.03% 60 Profitability Ratios: 61 Net Profit Margin 62 Return on Assets 63 Return on Equity 25.38% 51.00% 10.72 64 Asset Utilization Ratios: 65 Receivables Turnover 66 Average Collection Period 67 Inventory Turnover 68 Capital Asset Turnover 34.05 3.35 13.22 69 Total Asset Turnover 1.95 70 Liquidity Ratios 71 Current Ratio 72 Quick Ratio 1.79 1.09 50.24% 12.84 73 Debt Utilization Ratios 74 Debt to Total Assets 75 Times Interest Earned 76 77 Other 78 Growth in revenues 79 Growth in net income 80 Dividend payout ratio 81 82 DPS 83 EPS 84 Template 7.00% 5.50%
Step by Step Solution
There are 3 Steps involved in it

Get step-by-step solutions from verified subject matter experts