

Question: Please find and explain. Standard deviation,sample stat, tstat, pvalue. There will be two groups that the income categories will be distributed into . For group
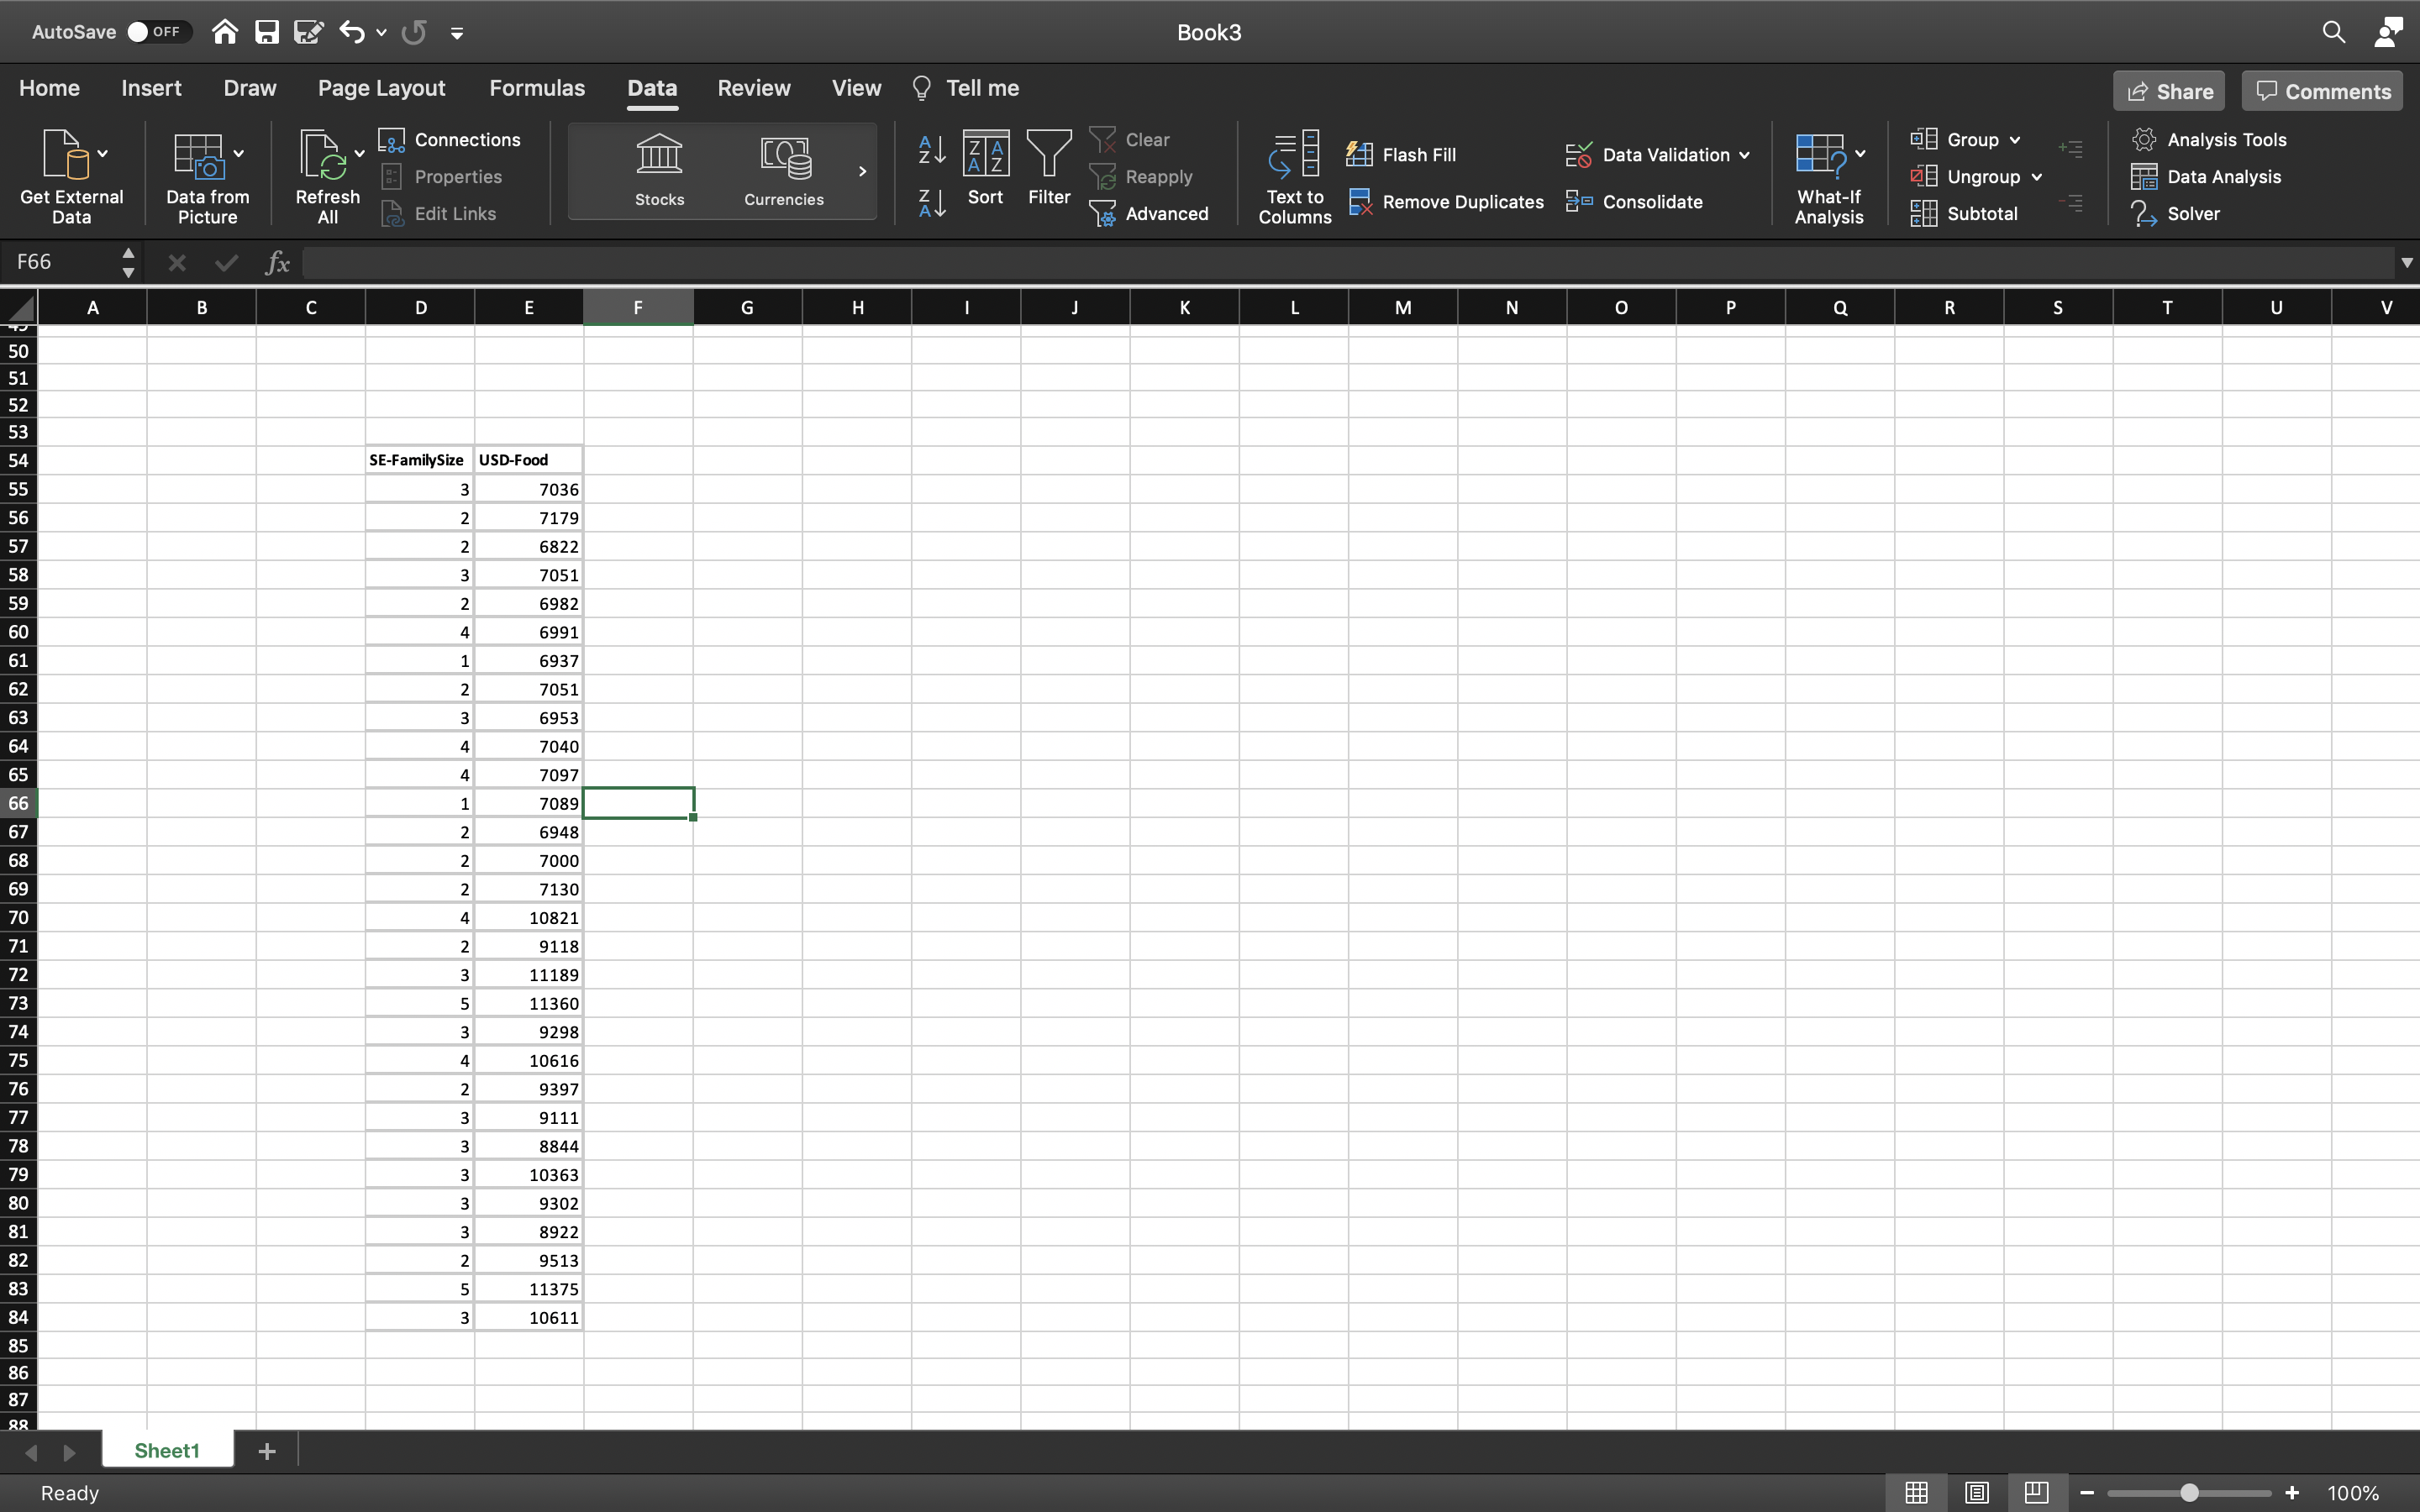
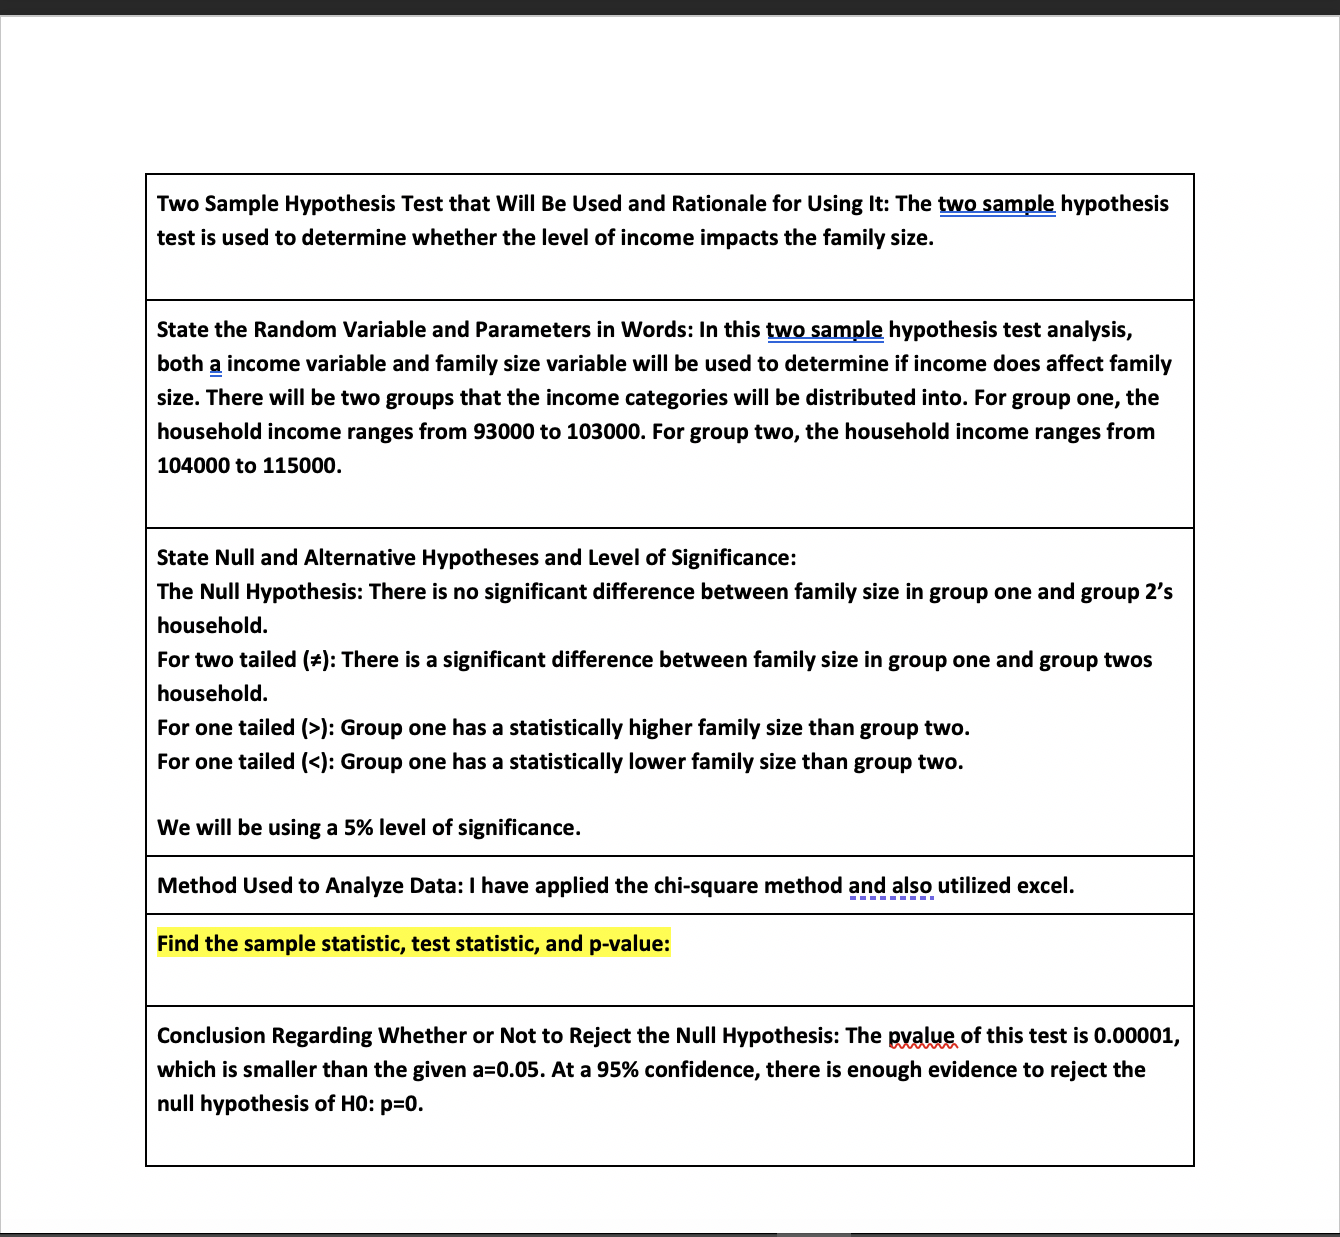
Please find and explain. Standard deviation,sample stat, tstat, pvalue. There will be two groups that the income categories will be distributed into . For group one, the household income that ranges from 93000 to 103000. For group two, the household income that ranges from 104000 to 115000.
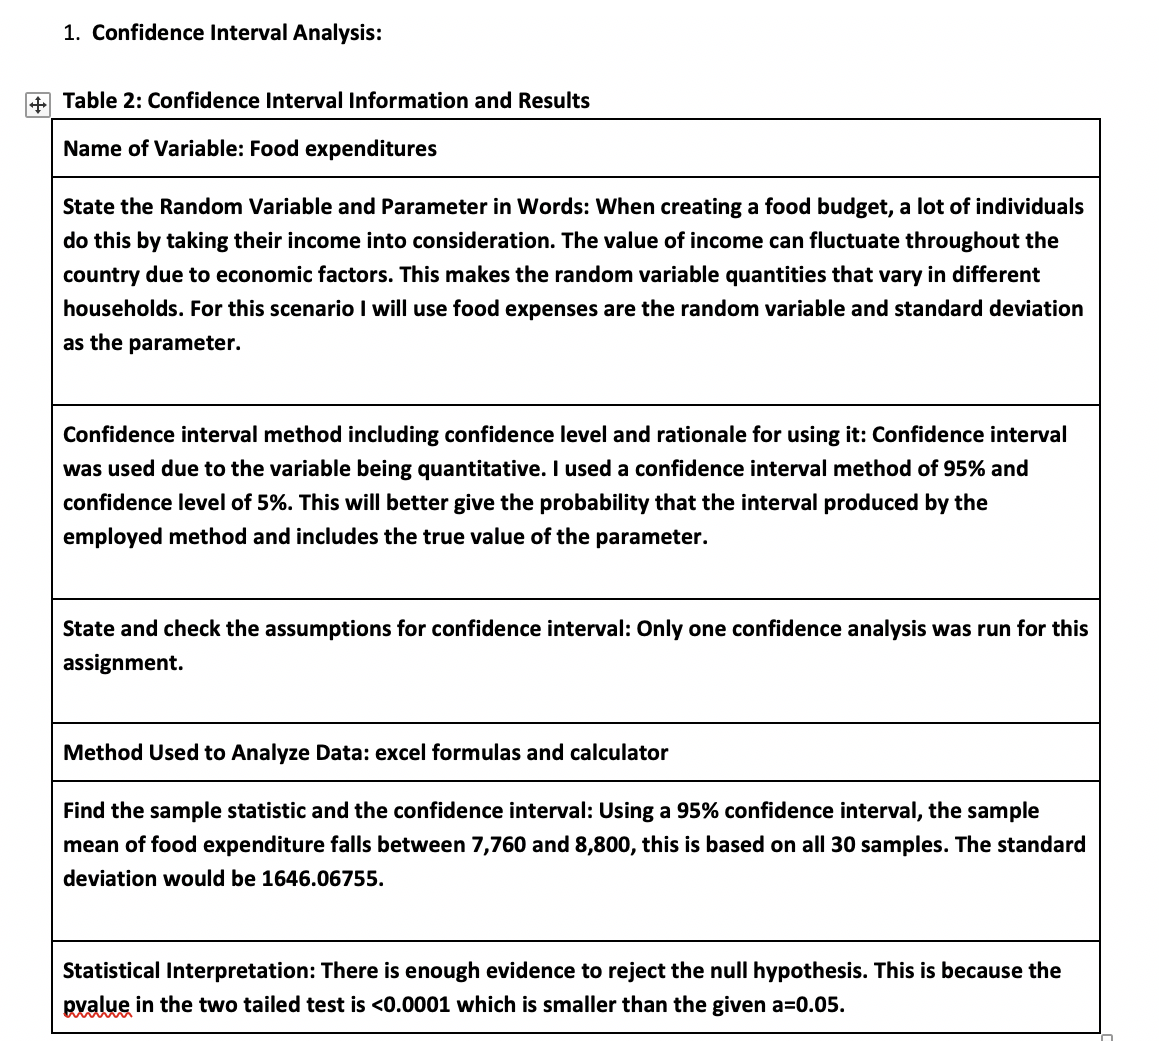
AutoSave . OFF Book3 Q Home Insert Draw Page Layout Formulas Data Review View Tell me Share Comments v L& Connections el Clear Group Analysis Tools Flash Fill Data Validation Properties Reapply Ungroup v Data Analysis Get External Data from Refresh Stocks Currencies Sort Filter Text to Ex Remove Duplicates Consolidate What-If Data Picture All Edit Links Advanced Columns Analysis Subtotal E ? Solver F66 X fx B C D E F G H M N P Q R S T U SE-FamilySize USD-Food 7036 7179 5822 7051 6982 6991 6937 7051 6953 7040 7097 7089 6948 7000 7130 W U N W W W W W N A W U W N A N N N H A A W N H A N W N N W 10821 91 18 11189 11360 9298 10616 9397 9111 8844 1036 9302 8922 9513 11375 10611 Sheet1 + Ready + 100%1. Confidence Interval Analysis: + Table 2: Confidence Interval Information and Results Name of Variable: Food expenditures State the Random Variable and Parameter in Words: When creating a food budget, a lot of individuals do this by taking their income into consideration. The value of income can fluctuate throughout the country due to economic factors. This makes the random variable quantities that vary in different households. For this scenario I will use food expenses are the random variable and standard deviation as the parameter. Confidence interval method including confidence level and rationale for using it: Confidence interval was used due to the variable being quantitative. I used a confidence interval method of 95% and confidence level of 5%. This will better give the probability that the interval produced by the employed method and includes the true value of the parameter. State and check the assumptions for confidence interval: Only one confidence analysis was run for this assignment. Method Used to Analyze Data: excel formulas and calculator Find the sample statistic and the confidence interval: Using a 95% confidence interval, the sample mean of food expenditure falls between 7,760 and 8,800, this is based on all 30 samples. The standard deviation would be 1646.06755. Statistical Interpretation: There is enough evidence to reject the null hypothesis. This is because the pvalue in the two tailed test is ): Group one has a statistically higher family size than group two. For one tailed (
Step by Step Solution
There are 3 Steps involved in it

Get step-by-step solutions from verified subject matter experts