

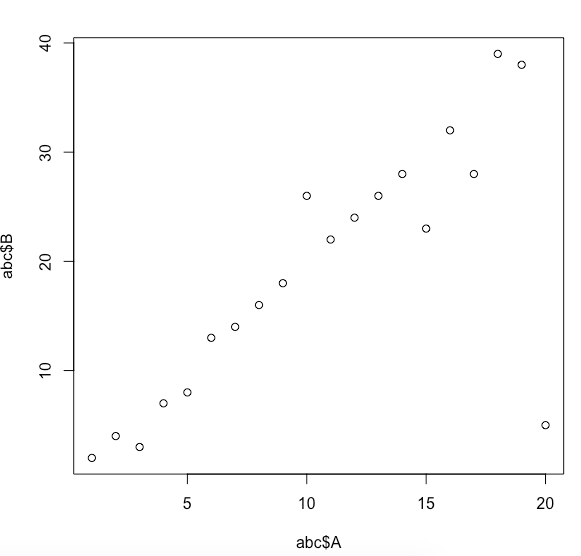
Question: Please find below attached scatterplot between A and B. If the outlier (x=20, y=5) is removed, how will the statistical significance of a hypothesis test
- Please find below attached scatterplot between A and B. If the outlier (x=20, y=5) is removed, how will the statistical significance of a hypothesis test of b1 change? What about the sample t-statistic and p-value for the previous hypothesis test change? Increase/ decrease/ no change?
- Please look at the regression output. Is there any way that I can calculate the Standard Error of test$x?
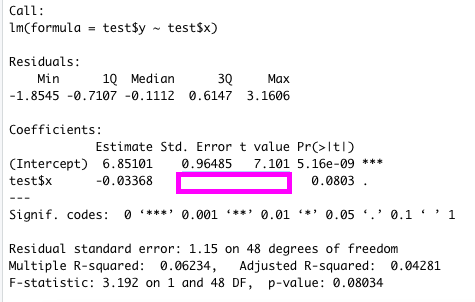
\fCall : Lm(formula = testly ~ testsx) Residuals: Min 10 Median 30 Max -1. 8545 -0.7107 -0. 1112 0.6147 3.1606 Coefficients : Estimate Std. Error t value Pr(>Itl) (Intercept) 6.85101 0.96485 7.101 5.16e-09 test$x -0.03368 0.0803 . Signif. codes: 0 '***' 0.001 '* *' 0.01 *' 0.05 '. ' 0.1 ' ' 1 Residual standard error: 1.15 on 48 degrees of freedom Multiple R-squared: 0.06234, Adjusted R-squared: 0.04281 F-statistic: 3.192 on 1 and 48 DF, p-value: 0.08034
Step by Step Solution
There are 3 Steps involved in it
1 Expert Approved Answer
Step: 1 Unlock

Question Has Been Solved by an Expert!
Get step-by-step solutions from verified subject matter experts
Step: 2 Unlock
Step: 3 Unlock