

Question: Please find test stat and p-value A newspaper reported on preferred types of office communication by different age groups. Suppose the results were based on
Please find test stat and p-value
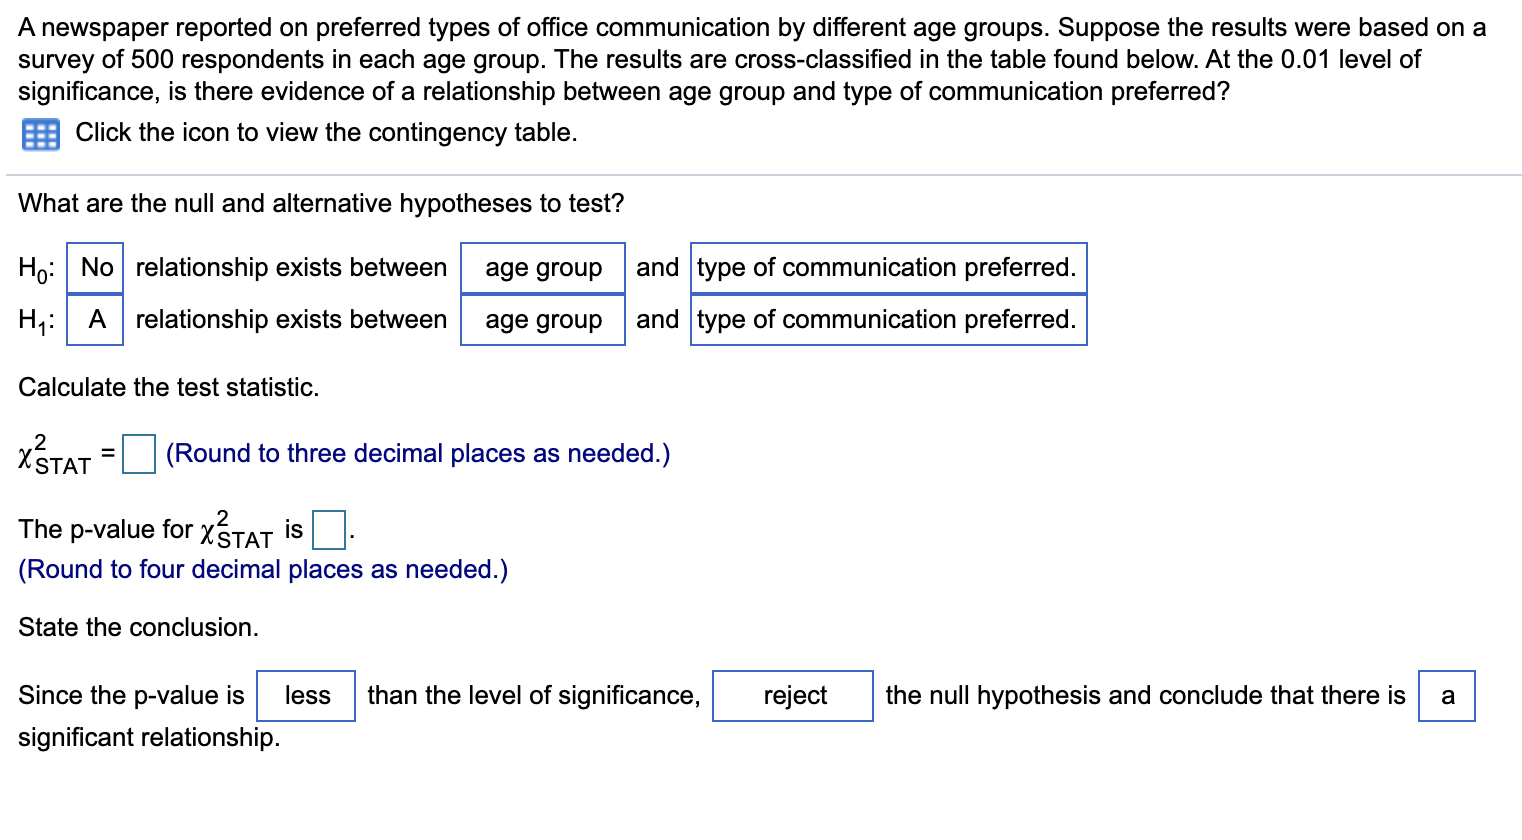
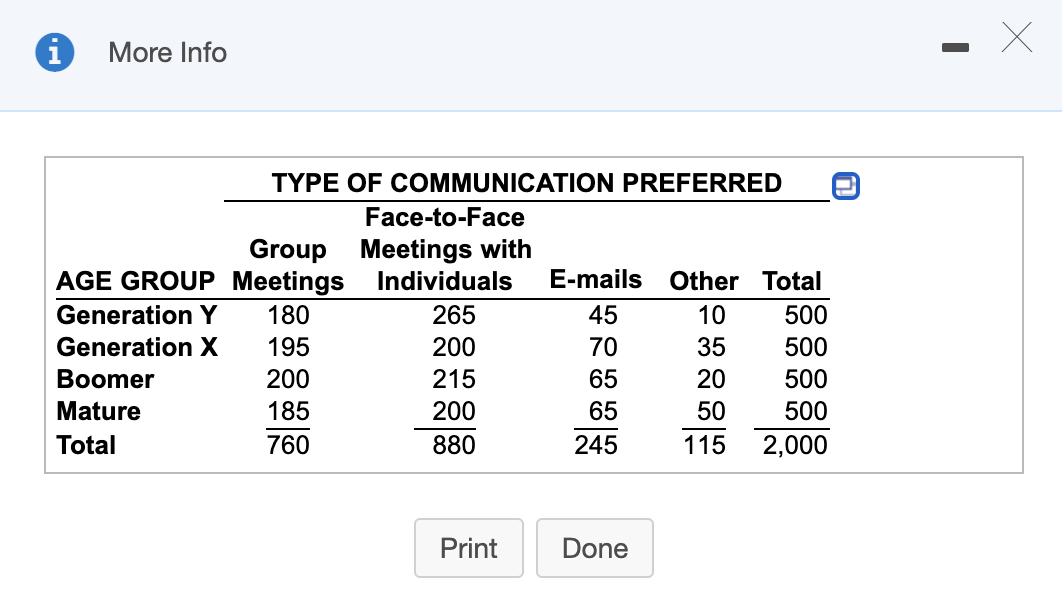
A newspaper reported on preferred types of office communication by different age groups. Suppose the results were based on a survey of 500 respondents in each age group. The results are cross-classified in the table found below. At the 0.01 level of significance, is there evidence of a relationship between age group and type of communication preferred? Click the icon to view the contingency table. What are the null and alternative hypotheses to test? Ho: No relationship exists between age group and type of communication preferred. A relationship exists between age group and type of communication preferred. Calculate the test statistic. X STAT = (Round to three decimal places as needed.) The p-value for XSTAT is (Round to four decimal places as needed.) State the conclusion. Since the p-value is less than the level of significance, reject the null hypothesis and conclude that there is a significant relationship.o More Info - X TYPE OF COMMUNICATION PREFERRED a Face-to-Face Group Meetings with AGE GROUP Meetings Individuals E-mails Other Total Generation Y 180 265 45 10 500 Generation X 195 200 70 35 500 Boomer 200 215 65 20 500 Mature E E 2 500 Total 760 880 245 1 15 2,000 Print Done
Step by Step Solution
There are 3 Steps involved in it

Get step-by-step solutions from verified subject matter experts