

Question: Please find test statistic and p-value The restaurant industry is conducting a survey on its consumers, categorizing adults into one of three consumer segments (optimistic,
Please find test statistic and p-value
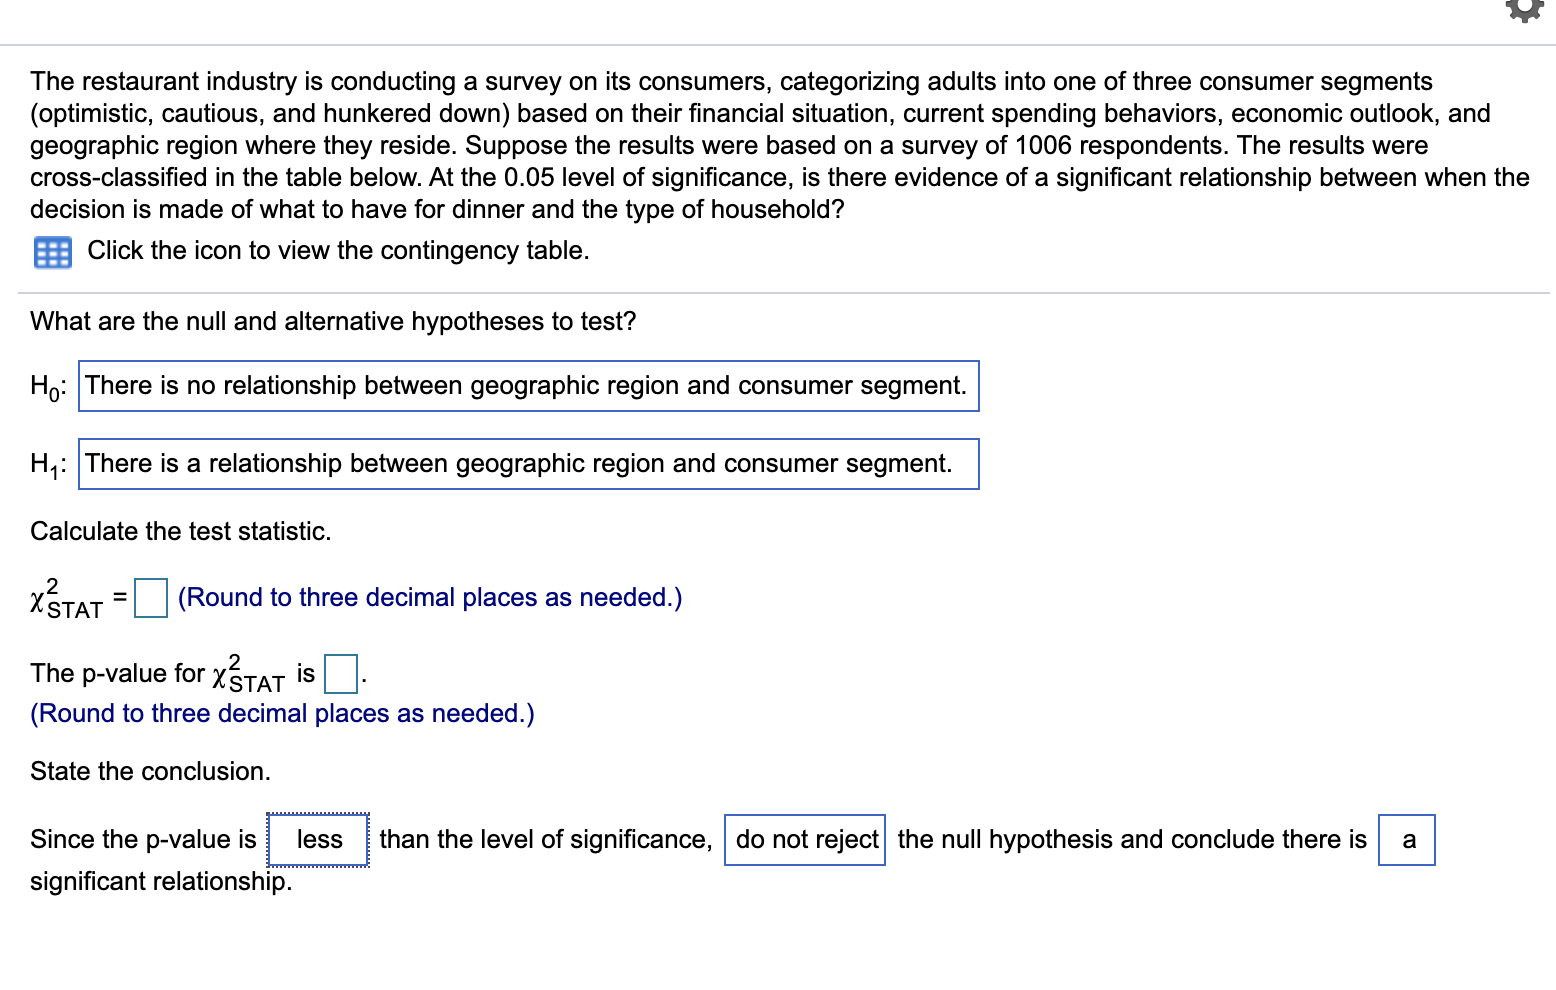
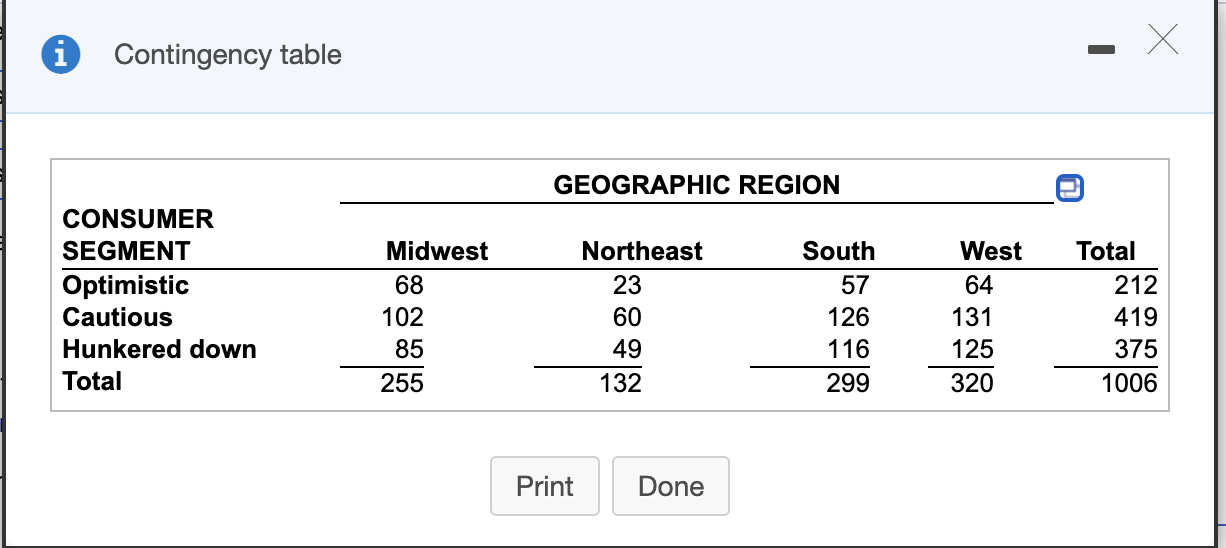
The restaurant industry is conducting a survey on its consumers, categorizing adults into one of three consumer segments (optimistic, cautious, and hunkered down) based on their financial situation, current spending behaviors, economic outlook, and geographic region where they reside. Suppose the results were based on a survey of 1006 respondents. The results were cross-classified in the table below. At the 0.05 level of significance, is there evidence of a significant relationship between when the decision is made of what to have for dinner and the type of household? Click the icon to view the contingency table. What are the null and alternative hypotheses to test? Ho: There is no relationship between geographic region and consumer segment. H: There is a relationship between geographic region and consumer segment. Calculate the test statistic. XSTAT = (Round to three decimal places as needed.) The p-value for XSTAT is (Round to three decimal places as needed.) State the conclusion. Since the p-value is less than the level of significance, do not reject the null hypothesis and conclude there is a significant relationship.o Contingency table GEOGRAPHIC REGION CONSUMER SEGMENT Midwest Northeast South West Total Optimistic 68 23 57 64 212 Cautious 102 60 126 131 419 Hunkered down 85 49 116 125 375 Total 255 1 32 299 320 1 006
Step by Step Solution
There are 3 Steps involved in it

Get step-by-step solutions from verified subject matter experts