

Question: Please find the correct answer as the answer chosen is currently wrong. I need full workout and explanation. Incorrect Question 4 0 / 10 pts
Please find the correct answer as the answer chosen is currently wrong. I need full workout and explanation.
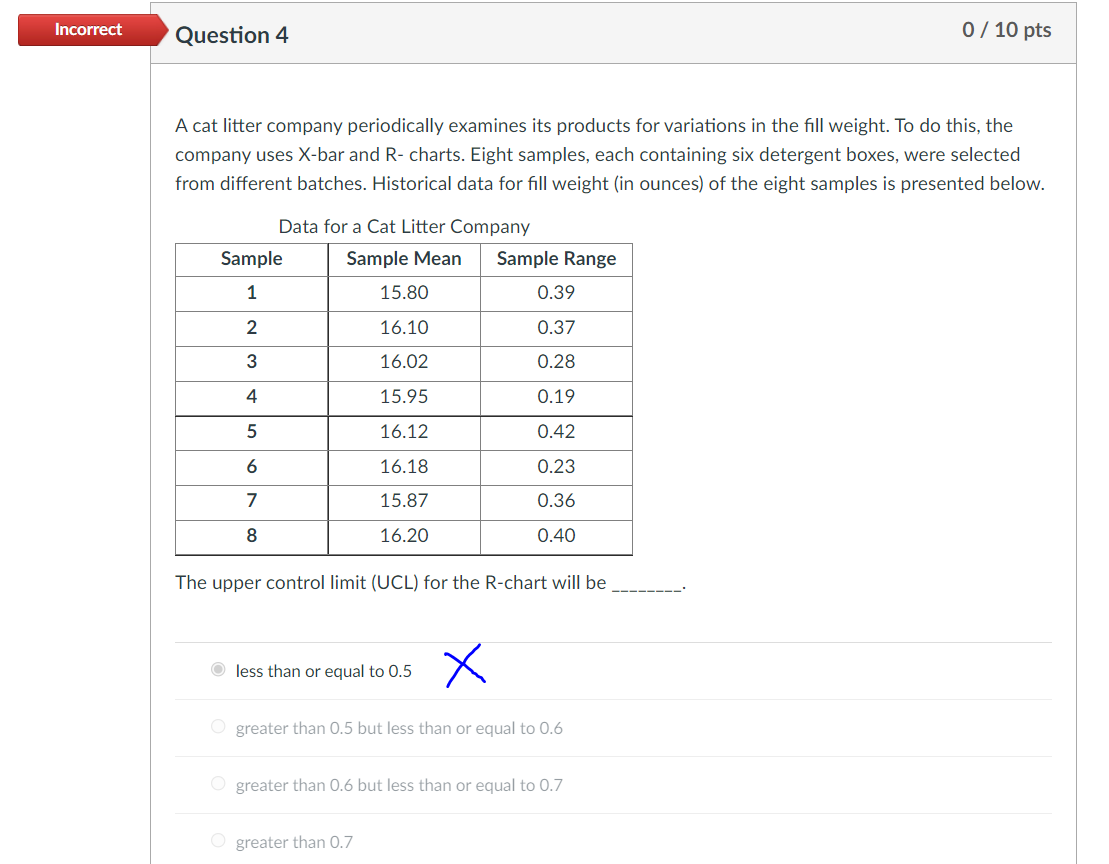
Incorrect Question 4 0 / 10 pts A cat litter company periodically examines its products for variations in the fill weight. To do this, the company uses X-bar and R-charts. Eight samples, each containing six detergent boxes, were selected from different batches. Historical data for fill weight (in ounces) of the eight samples is presented below. Data for a Cat Litter Company Sample Sample Mean Sample Range 1 15.80 0.39 2 16.10 0.37 3 16.02 0.28 4 15.95 0.19 5 16.12 0.42 6 16.18 0.23 7 15.87 0.36 8 16.20 0.40 The upper control limit (UCL) for the R-chart will be less than or equal to 0.5 X O greater than 0.5 but less than or equal to 0.6 greater than 0.6 but less than or equal to 0.7 greater than 0.7Step by Step Solution
There are 3 Steps involved in it
1 Expert Approved Answer
Step: 1 Unlock

Question Has Been Solved by an Expert!
Get step-by-step solutions from verified subject matter experts
Step: 2 Unlock
Step: 3 Unlock