

Question: PLEASE FIND THE PROBABILITY FOR WHEN THE SEMINAR WILL BE READY IN TIME (AS INDICATED IN THE EMPTY BOX BELOW) - USE THE STANDARD DEVIATION
PLEASE FIND THE PROBABILITY FOR WHEN THE SEMINAR WILL BE READY IN TIME (AS INDICATED IN THE EMPTY BOX BELOW) - USE THE STANDARD DEVIATION TABLE AS WELL 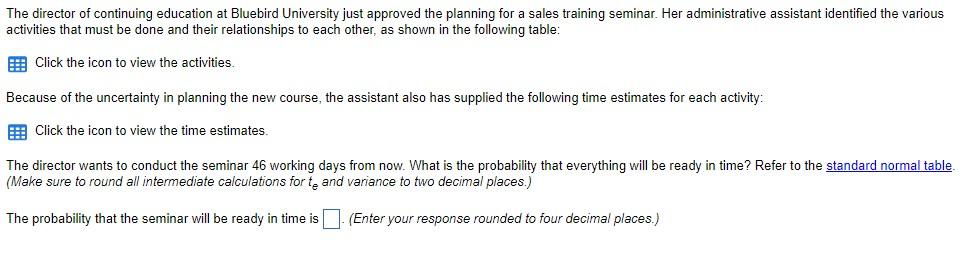
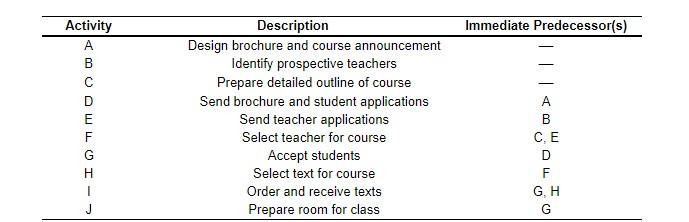
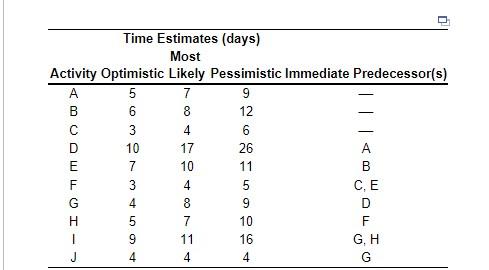
The director of continuing education at Bluebird University just approved the planning for a sales training seminar. Her administrative assistant identified the various activities that must be done and their relationships to each other, as shown in the following table: Click the icon to view the activities. Because of the uncertainty in planning the new course, the assistant also has supplied the following time estimates for each activity: Click the icon to view the time estimates. The director wants to conduct the seminar 46 working days from now. What is the probability that everything will be ready in time? Refer to the standard normal table. (Make sure to round all intermediate calculations for te and variance to two decimal places.) The probability that the seminar will be ready in time is (Enter your response rounded to four decimal places.) \begin{tabular}{ccc} \hline Activity & Description & Immediate Predecessor(s) \\ \hline A & Design brochure and course announcement & - \\ B & Identify prospective teachers & - \\ C & Prepare detailed outline of course & - \\ D & Send brochure and student applications & A \\ E & Send teacher applications & B \\ F & Select teacher for course & C, E \\ G & Accept students & D \\ H & Select text for course & F \\ I & Order and receive texts & G, H \\ J & Prepare room for class & G \end{tabular} \begin{tabular}{ccccc} \hline \multicolumn{5}{c}{TimeEstimates(days)Most} \\ Activity & Optimistic Likely Pessimistic Immediate Predecessor(s) \\ \hline A & 5 & 7 & 9 & - \\ B & 6 & 8 & 12 & - \\ C & 3 & 4 & 6 & - \\ D & 10 & 17 & 26 & A \\ E & 7 & 10 & 11 & B \\ F & 3 & 4 & 5 & C, E \\ G & 4 & 8 & 9 & D \\ H & 5 & 7 & 10 & F \\ I & 9 & 11 & 16 & G, H \\ J & 4 & 4 & 4 & G \\ \hline \end{tabular} The table below shows the total area under the normal curve for a point that is Z standard deviations to the right of the mean
Step by Step Solution
There are 3 Steps involved in it

Get step-by-step solutions from verified subject matter experts