

Question: Please find the question attached in the picture. Looking forward to your answer 3. The sample ACF and PACF plots of a mean-corrected time series
Please find the question attached in the picture. Looking forward to your answer
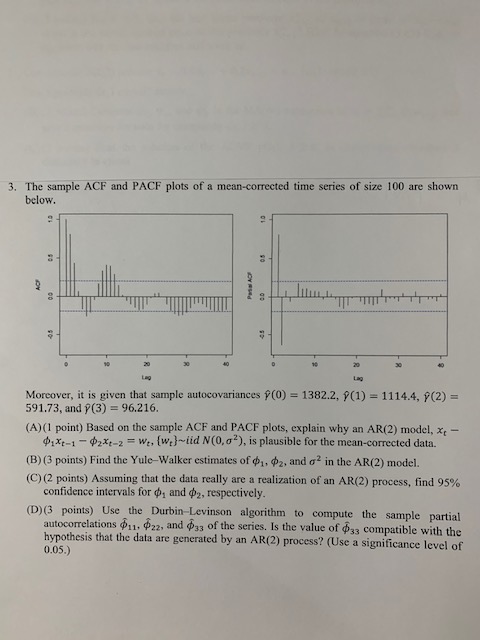
3. The sample ACF and PACF plots of a mean-corrected time series of size 100 are shown below. ACE Moreover, it is given that sample autocovariances p(0) = 1382.2, p(1) = 1114.4, p(2) = 591.73, and p(3) = 96.216. (A) (1 point) Based on the sample ACF and PACF plots, explain why an AR(2) model, x - Pilt-1 - $2xt-2 = we, (wal-did N(0.o'), is plausible for the mean-corrected data. (B) (3 points) Find the Yule Walker estimates of d, $2, and of in the AR(2) model. (C) (2 points) Assuming that the data really are a realization of an AR(2) process, find 95% confidence intervals for o, and $2, respectively. (D) (3 points) Use the Durbin-Levinson algorithm to compute the sample partial autocorrelations $11. $22, and #33 of the series. Is the value of $3 compatible with the hypothesis that the data are generated by an AR(2) process? (Use a significance level of 0.05.)
Step by Step Solution
There are 3 Steps involved in it

Get step-by-step solutions from verified subject matter experts