

Question: Please find the test statistic The data table below contains the amounts that a sample of nine customers spent for lunch (in dollars) at a
Please find the test statistic
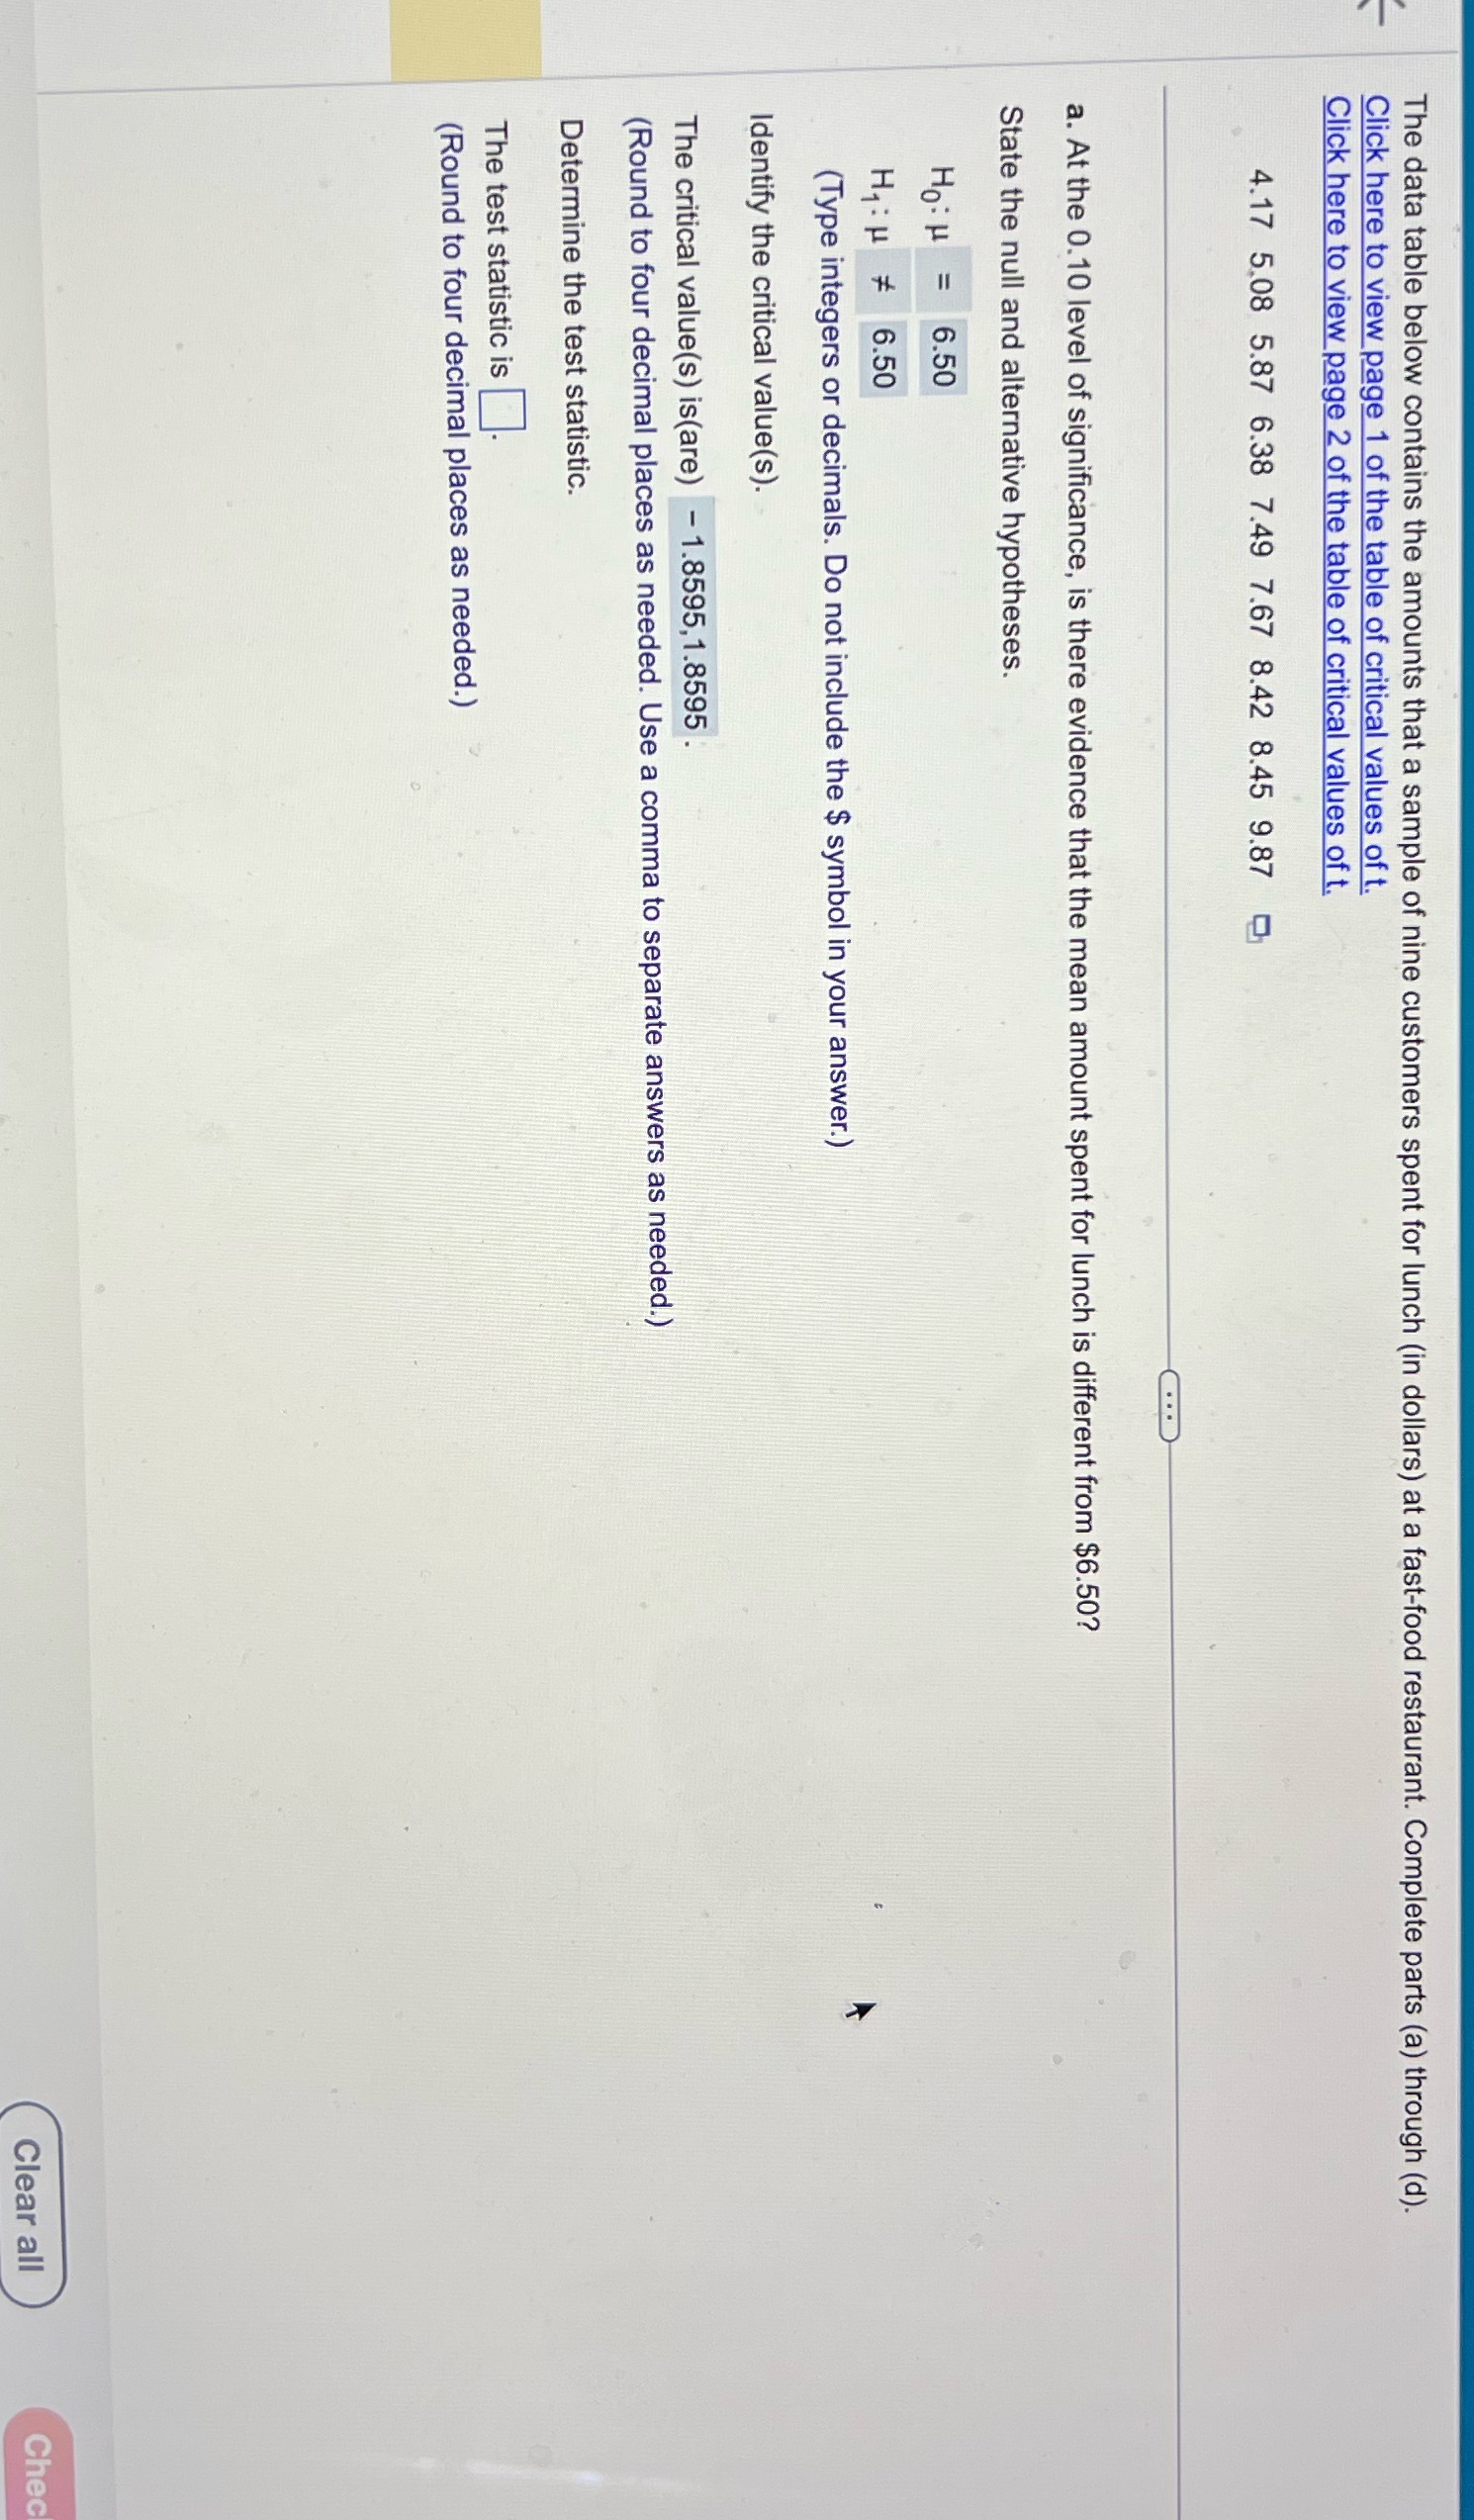
The data table below contains the amounts that a sample of nine customers spent for lunch (in dollars) at a fast-food restaurant. Complete parts (a) through (d). Click here to view page 1 of the table of critical values of t. Click here to view page 2 of the table of critical values of t. 4.17 5.08 5.87 6.38 7.49 7.67 8.42 8.45 9.87 a. At the 0.10 level of significance, is there evidence that the mean amount spent for lunch is different from $6.50? State the null and alternative hypotheses. Ho: H = 6.50 Hq: u # 6.50 (Type integers or decimals. Do not include the $ symbol in your answer.) Identify the critical value(s). The critical value(s) is(are) - 1.8595, 1.8595 . (Round to four decimal places as needed. Use a comma to separate answers as needed.) Determine the test statistic. The test statistic is (Round to four decimal places as needed.) Clear all Chec
Step by Step Solution
There are 3 Steps involved in it

Get step-by-step solutions from verified subject matter experts