

Question: please fix any errors i might have made and also please answer what to put for project cash flows and profit index Project Project Cash
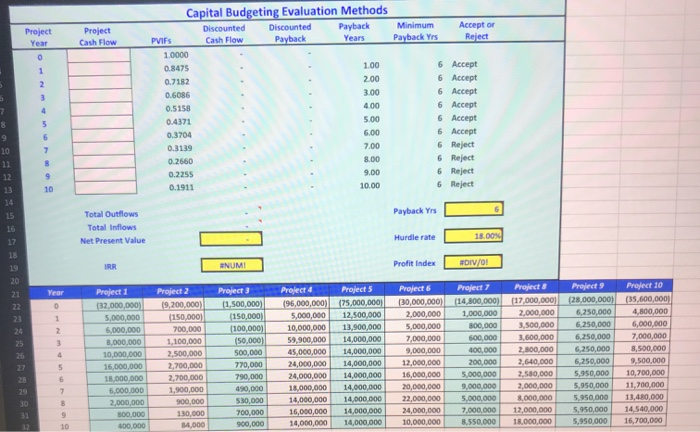
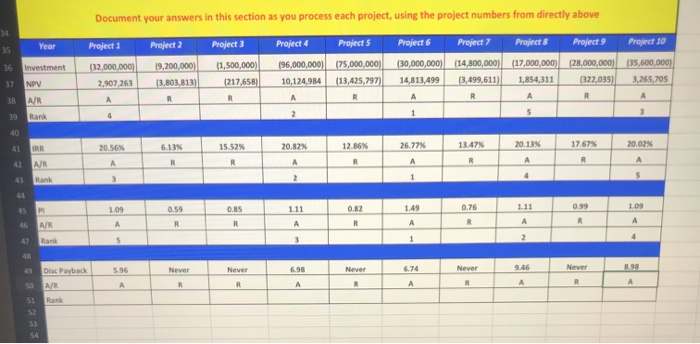
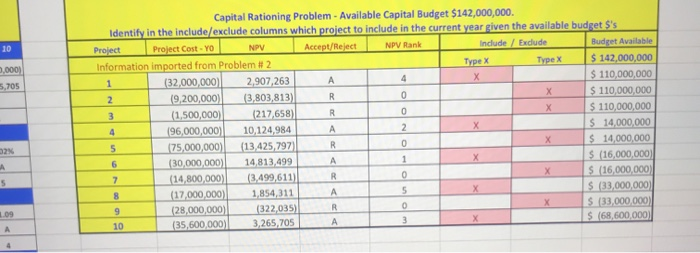
Project Project Cash Flow Accept or Reject 100 Capital Budgeting Evaluation Methods Discounted Discounted Payback Minimum PVIES Cash Flow Payback Payback Yrs 1.0000 0.8475 6 0.7182 6 6085 6 0.5158 6 0.4371 5.00 6 0.3704 6.00 6 0.3139 7.00 6 0.2560 8.00 6 0.2255 9.00 6 0.1911 10.00 6 Accept Accept Accept Accept Accept Accept Reject Reject Reject Reject Payback Yrs Total Outflows Total Inflows Net Present Value Hurdle rate 18.00 NUM Profit Index IV/0! Year Project 1 132.000.000) 5.000.000 5.000.000 8,000,000 10.000.000 16,000,000 18,000,000 6.000.000 2.000.000 500 000 Project 2 19,200,000) (150.000) 700,000 1.100.000 2.500.000 2.700,000 2.700,000 Project 3 11,500,000) (150,000) 100,000) 150.000) 500,000 770,000 790,000 490,000 50.000 700.000 900.000 Project 4 196,000,000) 5,000,000 10,000,000 59.900.000 45,000,000 24,000,000 24,000,000 18,000,000 14.000.000 16,000,000 14.000.000 Projects 175,000,000 12.500.000 13,900,000 14 000 000 14,000,000 14,000,000 14,000,000 14.000.000 14.000000 14.000.000 14.000.000 Project 6 (30,000,000) 2,000,000 5,000,000 7,000,000 9,000,000 12,000,000 Project (14,800,000) 1,000,000 300,000 500.000 600.000 200.000 5,000,000 9,000,000 .000.000 7000.000 ESSO 000 Projects (17,000,000) 2,000,000 3,500,000 3.600.000 2.800.000 2.540,000 2,580,000 2,000,000 8.000.000 12,000,000 18 000 000 Project (28,000,000) 250,000 250.000 6 250.000 6.250.000 5.250.000 5.950,000 5,950,000 5.950.000 5,950,000 000 Project 10 (35,600,000) 4.800,000 6,000,000 7.000.000 3.500.000 2.500.000 10,700,000 11,700,000 11.400,000 14.500.000 16.700,000 20,000,000 22.000.000 24,000,000 10.000.000 00 Document your answers in this section as you process each project, using the project numbers from directly above Year Project 1 Investment (32.000.000) 2.507 263 Project 2 19,200,000) 3.803,813) Project (1,500,000) 217,658 Project 96,000,000) 10,124,984 Projects 175,000,000) (13,425,797) Project (30,000,000) 14,813,499 Project (14,300,000) 3.499,611) Projects (17,000,000) 1,854,311 Project 28,000,000) 322,035) Project 10 35,600,000) 3,265,705 2016 6.13 20.82 26.77% 1757 20.02% Capital Rationing Problem - Available Capital Budget $142,000,000. Identify in the include/exclude columns which project to include in the current year given the available budget $'s Project Project Cost-YO NPV Accept/Reject NPV Rank include/Exclude Budget Available Information imported from Problem #2 Type Type X $ 142,000,000 (32,000,000) 2,907,263 4 X $ 110,000,000 19,200,000) (3,803,813) 0 X $ 110,000,000 (1,500,000 217,658) $ 110,000,000 196,000,000 10,124,984 $ 14,000,000 175,000,000) (13.425 297 $ 14,000,000 (30,000,000) 14,813,499 $ (16,000,000 (14,800,000) (3,499,611) $ 16,000,000) (27,000,000) 1.854,311 $ 33,000,000 (28,000,000) 322035) $ 33,000,000 (35,600,000 3,265, 705 $ (68,600,000) WONO Evaluate the 10 projects given by NPV, IRR, PI and Discounted Payback methods. Identify if they are acceptable or should be rejected. Finally, rank each method appropriately. You should use a hurdle rate of 18% and utilize 6 years as maximum payback years. Verify you have entered these factors into the appropriate box in the model so the results will calculate accurately for you. Remember you should only rank ACCEPTABLE projectsranking unacceptable projects is incorrect and a deduction in your score. If a Payback project never pays off, you may simply indicate Never in the documentation grid; otherwise the model will indicate the payback results. Using the results of your above analysis, various information elements will feed the problem section dealing with capital rationing. Finish the problem by identifying which projects should be done by management with the given capital budget of $142,000,000
Step by Step Solution
There are 3 Steps involved in it

Get step-by-step solutions from verified subject matter experts