

Question: please follow same chart format as the question. every highlighted area on the graph must be filled DataSpan, Inc., automated its plant at the start
please follow same chart format as the question. every highlighted area on the graph must be filled
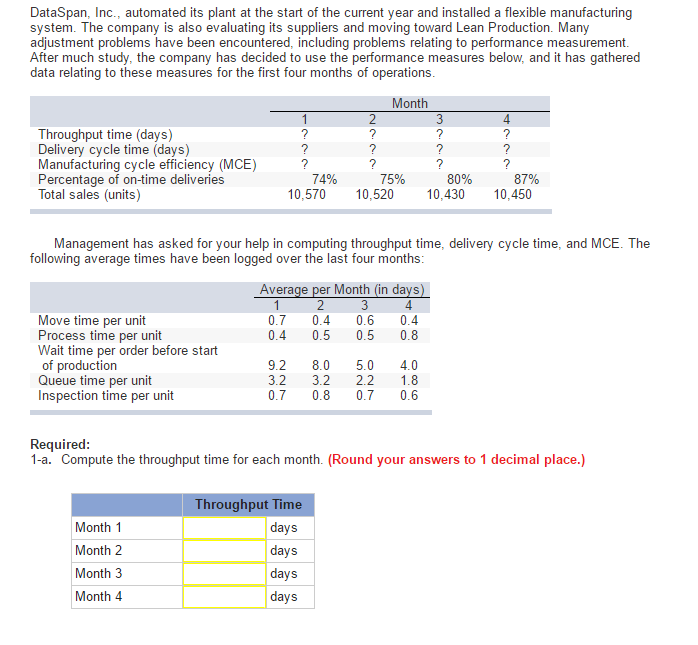
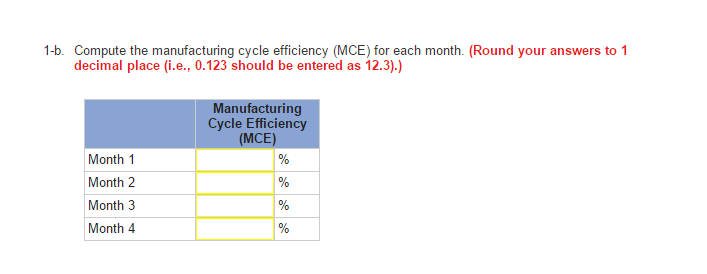
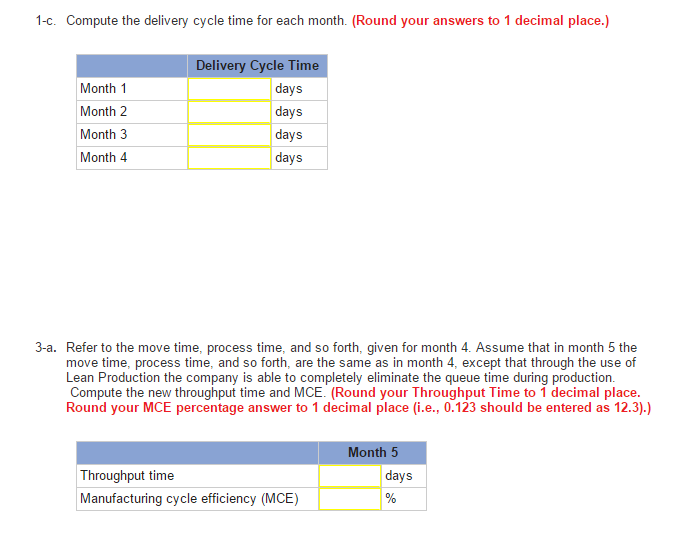
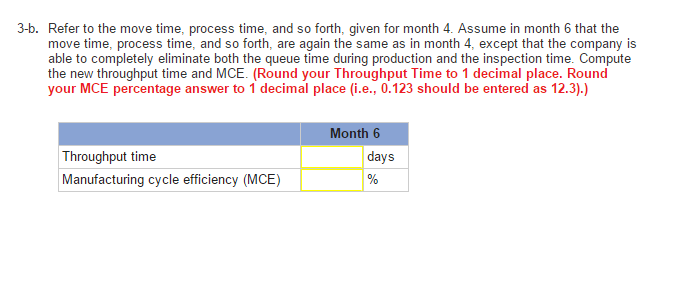
DataSpan, Inc., automated its plant at the start of the current year and installed a flexible manufacturing system. The company is also evaluating its suppliers and moving toward Lean Production. Many adjustment problems have been encountered, including problems relating to performance measurement After much study, the company has decided to use the performance measures below, and it has gathered data relating to these measures for the first four months of operations Month 4 Throughput time (days) Delivery cycle time (days) Manufacturing cycle efficiency (MCE) Percentage of on-time deliveries Total sales (units) 74% 75% 80% 87% 10,570 10,520 10,430 10,450 Management has asked for your help in computing throughput time, delivery cycle time, and MCE. The following average times have been logged over the last four months Average per Month (in days) 4 Move time per unit Process time per unit Wait time per order before start of production Queue time per unit Inspection time per unit 0.7 0.4 0.6 0.4 0.4 0.5 0.5 0.8 9.2 8.0 5.0 4.0 3.2 3.2 2.2 1.8 0.7 0.8 0.7 0.6 Required 1-a. Compute the throughput time for each month. (Round your answers to 1 decimal place.) Month 1 Month 2 Month 3 Month 4 Throughput Time days days days days
Step by Step Solution
There are 3 Steps involved in it

Get step-by-step solutions from verified subject matter experts