

Question: please follow the matlab background and answer the problem (e) to (g) only 2 MATLAB Background To read an audio signal and store it in
![whole file, [x,fs] = auread('FileName.au'); To read N samples of the audio](https://dsd5zvtm8ll6.cloudfront.net/si.experts.images/questions/2024/09/66efc29342387_94666efc292d84e2.jpg)
![file, use [x, fs] - auread (FileName', N); To playback the sound](https://dsd5zvtm8ll6.cloudfront.net/si.experts.images/questions/2024/09/66efc293c9126_94766efc2936a894.jpg)
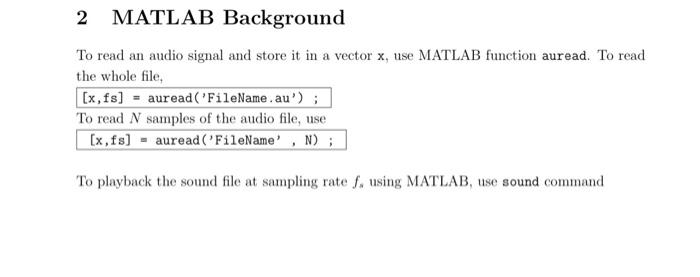
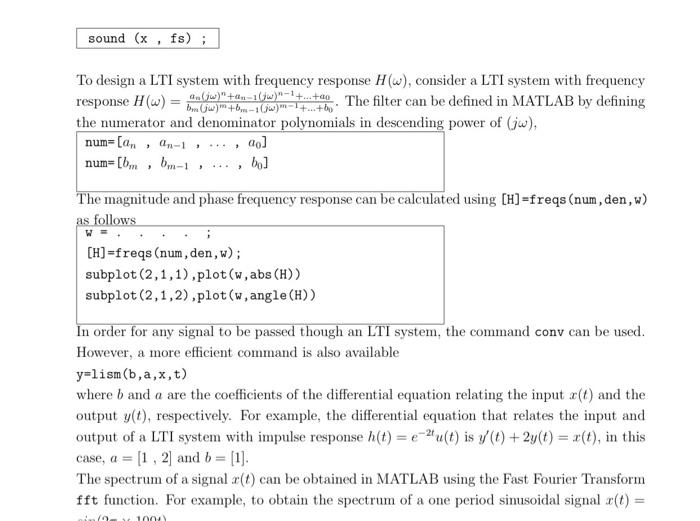
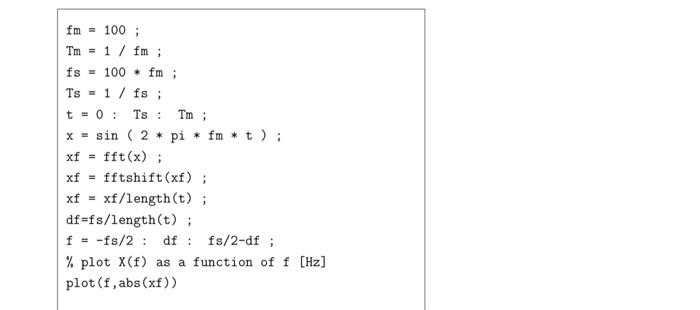
2 MATLAB Background To read an audio signal and store it in a vector x, use MATLAB function auread. To read the whole file, [x,fs] = auread('FileName.au'); To read N samples of the audio file, use [x, fs] - auread (FileName', N); To playback the sound file at sampling rate f. using MATLAB, use sound command sound (x, fs); To design a LTI system with frequency response H(w), consider a LTI system with frequency response (W) = then w** +-. The filter can be defined in MATLAB by defining the numerator and denominator polynomials in descending power of (jw), num=[an, n-1 ..., ao] num=[bm , bm-1 bo] The magnitude and phase frequency response can be calculated using [H]=freqs (num, den,w) as follows [H]=freqs (num, den,w); subplot(2,1,1).plot(w, abs (H)) subplot(2,1,2).plot(w, angle (H)) In order for any signal to be passed though an LTI system, the command conv can be used. However, a more efficient command is also available y=lism (b, a,x,t) where b and a are the coefficients of the differential equation relating the input x(t) and the output y(D), respectively. For example, the differential equation that relates the input and output of a LTI system with impulse response h(t) = -2u(t) is v/() + 2y(t) = *(t), in this case, a = [1, 2] and b = [1]. The spectrum of a signal x(t) can be obtained in MATLAB using the Fast Fourier Transform fft function. For example, to obtain the spectrum of a one period sinusoidal signal c(t) = 100) fm = 100; Tm = 1 / fm; fs = 100 * fm; Ts - 1/fs ; t = 0: Ts: Tm; x = sin ( 2 * pi * fm * t); xf = fft(x); xf = fftshift(xf); xf = xf/length(t); df=fs/length(t); f = -fs/2: df: fs/2-df; % plot X(f) as a function of plot (f, abs(xf)) [Hz] (a) Download the audio file from the elearning course page. Extract the file and save it in the MATLAB work directory. (b) Read the whole file into MATLAB and store it in the vector m. (c) Determine the length of the audio file in seconds. D (d) Play the sound file using MATLAB and listen to the signal carefully at a sampling rate 8000 Hz (e) Use MATLAB to obtain the spectrum of the audio signal, m(t), for this you can use the provided function (Xw,w] =SpecSigProj(x,t). For more information about this func- tion type help SpecSigProj. Then, according to the channel bandwidth requirement, design a fifth order Butterworth filter to pass the signal frequency components up to the required bandwidth. In this case the num and den can be calculated automatically using butter (N,wc,'s') command as shown in class. Show the frequency response of the designed system, the spectrum of the signal m(t) and melt) at the input and output of the LTI system, H(w). In your report show the complete design of H.(w) and the using butter (N,wc, ,'S') command as shown in class. Show the frequency response of the designed system, the spectrum of the signal m(t) and me(t) at the input and output of the LTI system, H/(w). In your report show the complete design of H.(w) and the expression of the frequency response, input spectrum, output spectrum and the % energy lost due to H.(w) insertion. (f) Suppose the channel is an ideal LTI system with band width 4 KHz, in this case the received signal is e(t). Use MATLAB to plot the spectrum of the signal r(t) = *(t) cos(27 x 15 10%t) right after the multiplication. In your report show the plot of R(w). (g) Depending on the obtained R(w), design a Butterworth LTI H (Wsuch that m(t) = m(t). Write down H.(w). Listen to the signal m(t) and compare it with the original audio m(t). In your report show the complete design of H2(w) and spectrum at the output, MW) 2 MATLAB Background To read an audio signal and store it in a vector x, use MATLAB function auread. To read the whole file, [x,fs] = auread('FileName.au'); To read N samples of the audio file, use [x, fs] - auread (FileName', N); To playback the sound file at sampling rate f. using MATLAB, use sound command sound (x, fs); To design a LTI system with frequency response H(w), consider a LTI system with frequency response (W) = then w** +-. The filter can be defined in MATLAB by defining the numerator and denominator polynomials in descending power of (jw), num=[an, n-1 ..., ao] num=[bm , bm-1 bo] The magnitude and phase frequency response can be calculated using [H]=freqs (num, den,w) as follows [H]=freqs (num, den,w); subplot(2,1,1).plot(w, abs (H)) subplot(2,1,2).plot(w, angle (H)) In order for any signal to be passed though an LTI system, the command conv can be used. However, a more efficient command is also available y=lism (b, a,x,t) where b and a are the coefficients of the differential equation relating the input x(t) and the output y(D), respectively. For example, the differential equation that relates the input and output of a LTI system with impulse response h(t) = -2u(t) is v/() + 2y(t) = *(t), in this case, a = [1, 2] and b = [1]. The spectrum of a signal x(t) can be obtained in MATLAB using the Fast Fourier Transform fft function. For example, to obtain the spectrum of a one period sinusoidal signal c(t) = 100) fm = 100; Tm = 1 / fm; fs = 100 * fm; Ts - 1/fs ; t = 0: Ts: Tm; x = sin ( 2 * pi * fm * t); xf = fft(x); xf = fftshift(xf); xf = xf/length(t); df=fs/length(t); f = -fs/2: df: fs/2-df; % plot X(f) as a function of plot (f, abs(xf)) [Hz] (a) Download the audio file from the elearning course page. Extract the file and save it in the MATLAB work directory. (b) Read the whole file into MATLAB and store it in the vector m. (c) Determine the length of the audio file in seconds. D (d) Play the sound file using MATLAB and listen to the signal carefully at a sampling rate 8000 Hz (e) Use MATLAB to obtain the spectrum of the audio signal, m(t), for this you can use the provided function (Xw,w] =SpecSigProj(x,t). For more information about this func- tion type help SpecSigProj. Then, according to the channel bandwidth requirement, design a fifth order Butterworth filter to pass the signal frequency components up to the required bandwidth. In this case the num and den can be calculated automatically using butter (N,wc,'s') command as shown in class. Show the frequency response of the designed system, the spectrum of the signal m(t) and melt) at the input and output of the LTI system, H(w). In your report show the complete design of H.(w) and the using butter (N,wc, ,'S') command as shown in class. Show the frequency response of the designed system, the spectrum of the signal m(t) and me(t) at the input and output of the LTI system, H/(w). In your report show the complete design of H.(w) and the expression of the frequency response, input spectrum, output spectrum and the % energy lost due to H.(w) insertion. (f) Suppose the channel is an ideal LTI system with band width 4 KHz, in this case the received signal is e(t). Use MATLAB to plot the spectrum of the signal r(t) = *(t) cos(27 x 15 10%t) right after the multiplication. In your report show the plot of R(w). (g) Depending on the obtained R(w), design a Butterworth LTI H (Wsuch that m(t) = m(t). Write down H.(w). Listen to the signal m(t) and compare it with the original audio m(t). In your report show the complete design of H2(w) and spectrum at the output, MW)
Step by Step Solution
There are 3 Steps involved in it

Get step-by-step solutions from verified subject matter experts