

Question: please gelp in this question with clear steps to understand it Part 1 of 6 Englehart Industries is evaluating investing in solar panels to provide
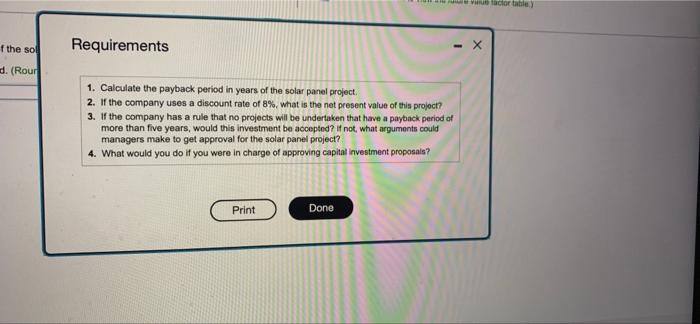
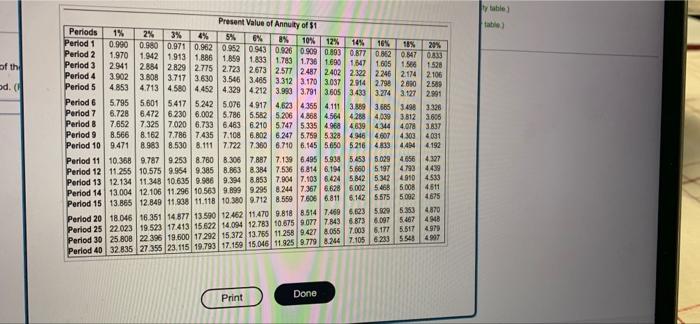
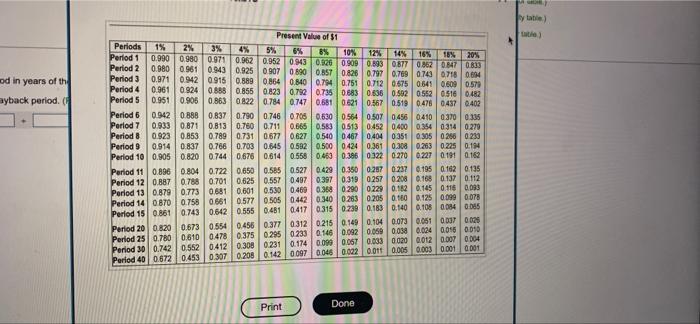
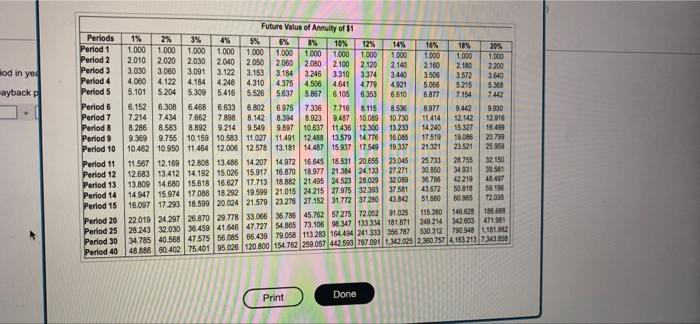
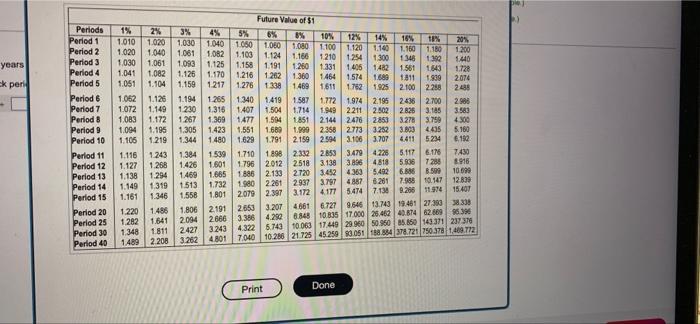
Part 1 of 6 Englehart Industries is evaluating investing in solar panels to provide some of the electrical needs of its main office building in Orlando, Florida. The solar panel project would cost $475,000 and would provide cost savings in its utility bills of $80,000 per year. It is anticipated that the solar panels would have a life of 20 years and would have no residual value Read the requirements GTC Requirement 1. Calculate the payback period in years of the solar panel project. Determine the formula, then calculate the payback period. (Round your answer to two decimal places) Payback period Points: 0 of 10 (Click the icon to view the present value annuty table.) (Click the icon to view the present value factor table) (Click the icon to view the future value annuity table) (Click the icon to view the future value factor table) Englehart Industries is evaluating investing in solar panels to provide some of the electrical needs of its main office building in Orlando, Florida. The solar panel project would cost $475,000 and would provide cost savings in its utility bills of $80,000 per year. It is anticipated that the solar panels would have a life of 20 years and would have no residual value. Read the requirements. 8 Requirement 1. Calculate the payback period in years of the solar panel project. Determine the formula, then calculate the payback period. (Round your answer to two decimal places.) Payback period O Point: 0 of 10 (Click the con to view the present value annuity tab (Click the icon to view the present value factor table (Click the icon to view the future value anmity table (Click the icon to view the futurs value fadorable of the so d. (Rour Avue factor table) Requirements 1. Calculate the payback period in years of the solar panel project. 2. If the company uses a discount rate of 8%, what is the net present value of this project? 3. If the company has a rule that no projects will be undertaken that have a payback period of more than five years, would this investment be accepted? If not, what arguments could managers make to get approval for the solar panel project? 4. What would you do if you were in charge of approving capital investment proposals? Print Done of the od. ( Present Value of Annuity of $1 4% 5% 6% Periods 1% Period 1 Period 2 8% 10% 12% Period 3 Period 4 Period 5 Period 6 Period 7 Period 8 Period 9 Period 10 2% 3% 0.990 0.980 0.971 0.962 0.952 0943 0.926 0.909 0.893 0.877 0.862 0847 0833 14% 16% 18% 20% 1.970 1.942 1913 1.886 1.859 1.833 1.783 1.736 1.600 1.647 1605 1.566 2.941 2.884 2.829 2.775 2.723 2.673 2.577 2.487 2.402 2.322 2.246 2174 1.528 3.902 3.808 3.717 3.630 3.546 3.465 3.312 3.170 3.037 2.914 2.798 2.800 2.589 2.106 4.853 4.713 4.580 4.452 4.329 4.212 3.993 3.791 3.605 3.433 3.274 3.127 2991 5.795 5.601 5.417 5.242 5.076 4.917 4.623 4.355 4.111 3.889 3.685 3.498 3.326 6.728 6.472 6230 6.002 5.786 5.582 5.206 4.868 4.564 4.288 4.039 3.812 3.606 7.652 7.325 7.020 6.733 6.463 6.210 5.747 5.335 4.968 4.639 4.344 4.078 3.837 8.566 8.162 7.786 7.435 7.108 6.802 6.247 5.759 5.328 9.471 8.983 8.530 8.111 7.722 7.360 6.710 6.145 5.650 10.368 9.787 9.253 8.760 8.306 7.887 7.139 6.495 5.938 11.255 10.575 9.954 9.385 8.863 8.384 7.536 6.814 6.194 12.134 11.348 10.635 9.986 9.394 8.853 7.904 7.103 6.424 13.004 12.106 11.296 10.563 9.899 9.295 8.244 7.367 6.628 12.849 11.938 11.118 10.380 9.712 8.559 7.606 6.811 4.946 4.607 4.303 4031 Period 11 5.216 4833 4494 4.192 4.327 4.439 Period 12 5.453 5.029 4656 5.660 5.197 4.793 5.842 5.342 6.002 5468 5.575 6.142 4.910 4.533 Period 13 5.008 4.511 Period 14 Period 15 5.092 4.675 13.865 6.623 5.529 5.353 4.870 6.873 6.097 5.467 4.948 Period 20 18.046 16.351 14.877 13.590 12.462 11.470 9.818 8.514 7469 Period 25 22.023 19.523 17.413 15.622 14.094 12.783 10.675 9.077 7.843 Period 30 25.808 22.396 19.600 17.292 15.372 13.765 11.258 9.427 32.835 27.355 23.115 19.793 17.159 15.046 11.925 9.779 8.244 7.003 6.177 5.517 4979 4.907 5.548 7.105 6233 Period 40 Print Done ty table) table) od in years of the ayback period. ( Present Value of $1 4% 5% Periods 1% 2% 3% 6% 8% 10% 12% 14% 16% 18% 20% Period 1 0.990 0.980 0.971 0.962 0.952 0.943 0.926 0.909 0.893 0877 0.862 0.847 0.833 Period 2 0.980 0.961 0.943 0.925 0.907 0890 0.857 0.826 0.797 0.769 0.743 0718 0694 Period 3 0.971 0.942 0915 0.889 0.864 0.840 0.794 0.751 Period 4 0.961 0.924 0888 0.855 Period 5 0.951 0.906 0.863 0.822 Period 6 0.942 0.888 0.837 0.790 Perlod 7 0.933 0.871 0.813 0.760 Period 8 0.923 0.853 0.789 0.731 Period 9 0.766 0.703 0.645 0.592 0.500 0.424 0.361 0.308 0.263 0.225 0.194 0.744 0.676 0.614 0.558 0.463 0.386 0.322 0270 0.227 0.191 0.162 0.804 0.722 0.650 0.585 0.527 0.429 0.350 0257 0237 0.195 0.162 0.135 0.887 0.788 0.701 0.625 0.557 0.497 0.397 0.319 0257 0.208 0.168 0.137 0.112 0.879 0.773 0.681 0.601 0.530 0.469 0.368 0.290 0.229 0.182 0.145 0.116 0.093 0.758 0.661 0.577 0.505 0.442 0.340 0.263 0.205 0.160 0.125 0.099 0.078 0.642 0.555 0.481 0.712 0.675 0.641 0.609 0.579 0823 0.792 0.735 0.683 0.636 0.502 0552 0516 0.482 0.784 0,747 0.681 0.621 0.567 0.519 0.476 0437 0.402 0.746 0.705 0.630 0.564 0.507 0.456 0410 0370 0.335 0.711 0.665 0.583 0.513 0.452 0.400 0.354 0314 0279 0.677 0.627 0.540 0.467 0404 0:351 0.305 0266 0233 0.914 0.837 Period 10 0.905 0.820 Period 11 0.896 Period 12 Period 13 Period 14 0.870 Period 15 0.861 0.743 0417 0315 0.239 0.183 0.140 0.108 0.084 0065 Period 20 0.820 0.673 0610 0.554 0.456 0.377 0.312 0.215 0.149 0.104 0.073 0.051 0.037 0.025 Period 25 0.780 0.478 0.375 0.295 0.233 0.146 0.092 0.059 0.038 0.024 0.018 0010 0.231 0.174 0.099 0.057 0.033 0.020 0012 0.007 0.004 Period 30 0.742 0.308 Period 40 0.672 0453 0.307 0.208 0.142 0.097 0.046 0.022 0.011 0.005 0.003 0.001 0.001 0.552 0412 Print Done by table) table) od in yea ayback p Periods 1% Period 1 Period 2 Period 3 Period 4 Period 5 Period 6 Period 7 Period 8 Period 9 Period 10 Period 11 Period 12 Period 13 Period 14 Period 15 Period 20 Period 25 Period 30 Period 40 Future Value of Annuity of $1 2% 3% 4% 3.030 5% 6% 8% 10% 12% 14% 16% 18% 20% 1.000 1.000 1.000 1.000 1.000 1.000 1.000 1,000 1.000 1.000 1.000 1.000 1.000 2.010 2.020 2.030 2.040 2.050 2.060 2.080 2.100 2.120 2.140 2.160 2.180 2.200 3.060 3.091 3.122 3.153 3.184 3.246 3.310 3.374 3.440 3.506 3.572 3.640 4.060 4.122 4.184 4.246 4.310 4.375 4.506 4.641 4.779 4.921 5.066 5.215 5.368 5.101 5.204 5.309 5.416 5.526 5.637 5.867 6.105 6.353 6.610 6.877 7.154 7,442 6.152 6.308 6.468 6.633 6.802 6.975 7.336 7.716 8115 8.536 8.977 9.442 9.930 7.214 7.434 7,662 7.898 8.142 8.394 8.923 9.487 10.089 10.730 11.414 12.142 12.916 8,583 8.892 9214 9.549 9.897 10.637 11.436 12.300 13.233 14.240 15.327 16.499 10.159 10.583 11.027 11.491 12.488 13.579 14.776 16.085 17.519 19.086 20.799 10.462 10.950 11.464 12.006 12.578 13.181 14.487 15.937 17.549 19.337 21:321 21.521 25.959 25.733 28.755 32.150 30.850 34.931 39.581 36.786 42.219 48.497 43.672 50.818 59.196 51.660 60.965 72.035 8.286 9.369 9.755 11.567 12.169 12.808 13.486 14.207 14.972 16.645 18.531 20.655 23.045 12.683 13.412 14.192 15.026 15.917 16.870 18.977 21.384 24.133 27271 13.809 14.680 15.618 16.627 17.713 18.882 21.495 24.523 28.029 32 089 14.947 15.974 17.086 18.292 19.599 21.015 24.215 27.975 32.393 37.581 16.097 17.293 18.599 20.024 21.579 23.276 27.152 31.772 37 280 43.842 115.380 146.628 186.688 22.019 24.297 26.870 29.778 33.066 36.786 45.762 57 275 72.052 91.025 28 243 32.030 36.459 41.646 47.727 54.865 73.106 96.347 133.334 181.871 249 214 342 603 471.981 34.785 40.568 47.575 56.085 66.439 79.058 113.283 164.494 241.333 356.787 530.312 790.948 1,181.882 48.886 60.402 75401 95.026 120 800 154.762 259.057 442.593 787.091 1,342.025 2.360.757 4.163.213 7.343 858 Print Done years ck peri + Future Value of $1 Periods 1% 3% 4% 2% 1.020 1.010 20% 5% 6% 8% 1.040 1.050 1.060 1.080 1.082 1.103 1.124 1.166 1.020 1.040 1.200 1.030 1.061 1.440 10% 12% 14% 16% 18% 1.030 1.100 1.120 1.140 1.160 1.180 1.061 1.210 1.254 1300 1346 1.392 1.093 1.125 1.158 1.191 1.260 1.331 1.406 1482 1.561 1.643 1.728 1.041 1.082 1.126 1.170 1.216 1.262 1.360 1.464 1.574 1.689 1811 1.939 2074 1.051 1.104 1.159 1.217 1.276 1.338 1.469 1,611 1.762 1.925 2.100 2.258 2488 1.052 1.126 1.194 1.265 1.340 1.419 1.587 1.772 1.974 2.195 2436 2.700 2.986 1.072 1.149 1.230 1.316 1.407 1.504 1.714 1.949 2211 2.502 2.826 3.185 3.583 1.083 1.172 1.267 1.369 1477 1.594 1.851 2144 2.476 2853 3.278 3.759 1.305 1.423 1.551 1.689 1.999 2.358 2773 3.252 3.803 4.435 1.344 1.480 1.629 1.791 5234 2.159 2.594 3.106 3.707 4.411 7.430 1.710 1.898 2.332 2853 3.479 4.228 5.117 6.176 5.936 7288 8916 3.138 3896 4.818 1.796 2012 2518 6.886 8.599 10.099 3.452 4.363 5.492 4887 12.839 3.797 7.988 10.147 6.261 15.407 5.474 7.138 9.266 11.974 4.177 4661 6.727 9.646 13.743 19.461 27.393 1.094 1.195 4.300 5.160 6.192 1.106 1.219 1.116 1.243 1.384 1.127 1.268 1.539 1.601 1.426 1.138 1.294 1.469 1.149 1.319 1.665 1.886 1.732 1.801 2.079 2.133 2.720 2.937 2.397 3.172 38.338 1.513 1.346 1.558 1.161 1.220 1.486 1.806 2.191 2.653 3.207 4.292 1,282 1.641 2.666 3.386 2.094 2427 3243 4.322 5.743 10.063 17.449 29.960 50.950 85.850 143371 237376 1.348 7.040 10.286 21.725 45.250 93.051 188.884 378.721 750.378 1,409.772 1.489 8.848 10.835 17.000 26.462 40.874 62.669 96.396 3.262 4.801 2.208 Done Print Period 1 Period 2 Period 3 Period 4 Period 5 Period 6 Period 7 Period 8 Period 9 Period 10 Period 11 Period 12 Period 13 Period 14 Period 15 Period 20 Period 25 Period 30 Period 40 1.980 2.261
Step by Step Solution
There are 3 Steps involved in it

Get step-by-step solutions from verified subject matter experts