

Question: PLEASE GIVE A CLEAR AND LEGIBLE ANSWER WITH A CLEAR DIAGRAM. The data on normal time, and cost and crash time and cost associated with
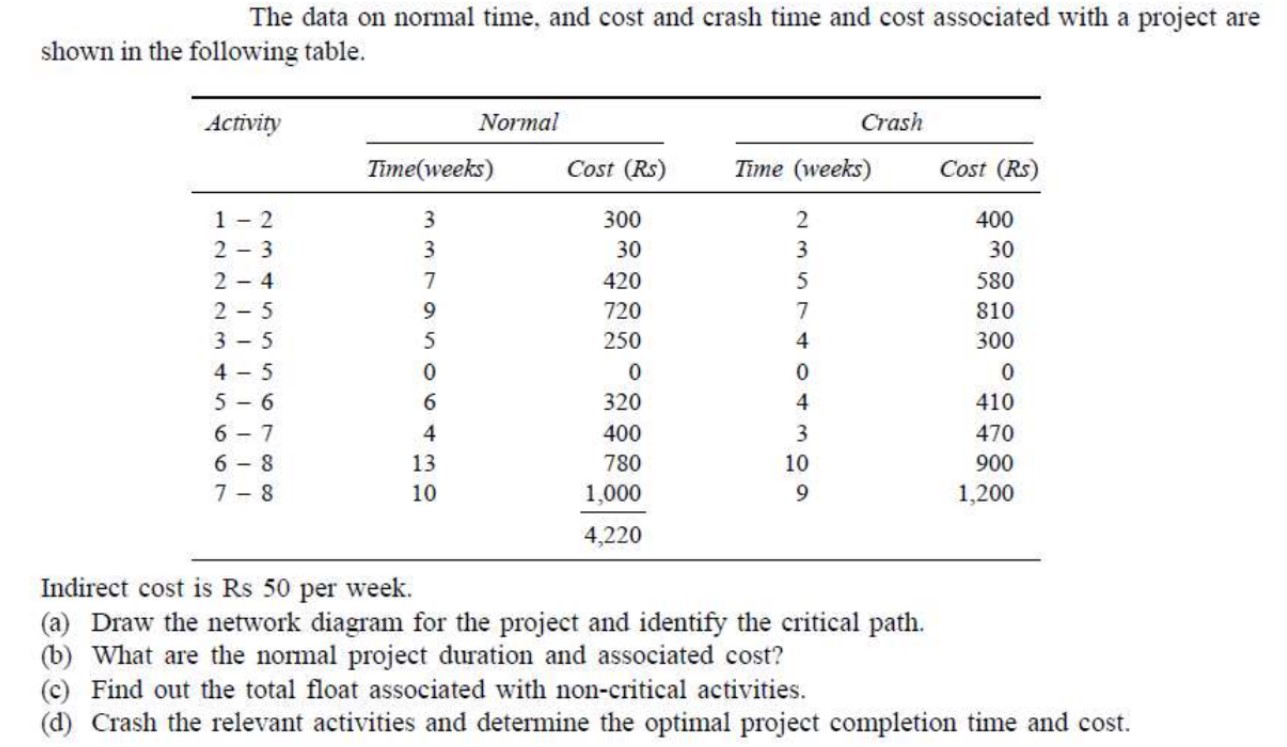
PLEASE GIVE A CLEAR AND LEGIBLE ANSWER WITH A CLEAR DIAGRAM. The data on normal time, and cost and crash time and cost associated with a project are shown in the following table.
tableActivityNormal,,CrashTimeweeksCost Rs Time weeksCost Rs
Indirect cost is Rs per week.
a Draw the network diagram for the project and identify the critical path.
b What are the normal project duration and associated cost?
c Find out the total float associated with noncritical activities.
d Crash the relevant activities and determine the optimal project completion time and cost.
Step by Step Solution
There are 3 Steps involved in it
1 Expert Approved Answer
Step: 1 Unlock

Question Has Been Solved by an Expert!
Get step-by-step solutions from verified subject matter experts
Step: 2 Unlock
Step: 3 Unlock