

Question: please give me a data table for this AQ Data Assignment INSTRUCTIONS You are to organize the assigned data set and prepare: - Presentable data
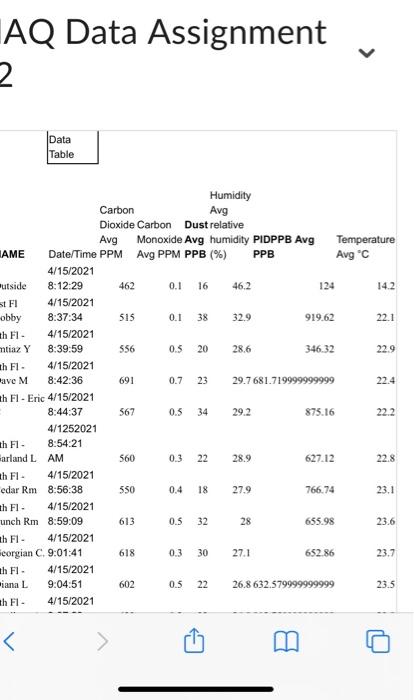
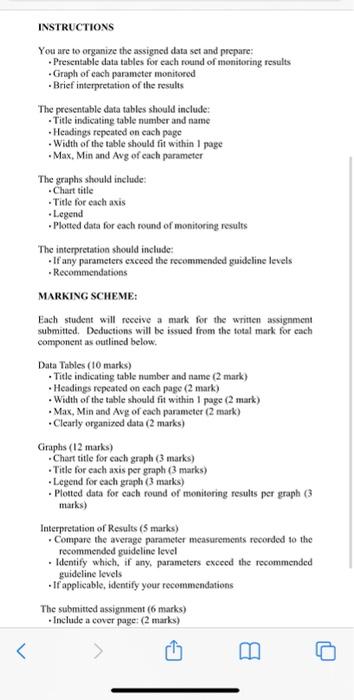
AQ Data Assignment INSTRUCTIONS You are to organize the assigned data set and prepare: - Presentable data tables for each round of monitoring results - Graph of each parameter monitored - Brief interpretation of the results The presentable data tables should include: - Title indicating table number and name - Headings repeated on cach page - Width of the table should fit within I page - Max, Min and Avg of each parameter The graphs should include: - Chart title - Title for each axis - Legend - Plotted data for each round of monitoring results The interpretation should include: - If any parameters exceed the recommended guideline levels - Recommendations MARKING SCHEME: Each student will receive a mark for the written assignment submitted. Deductions will be issued from the total mark for each component as outlined below. Data Tables (10 marks) - Title indicating table number and name ( 2 mark) - Headings repeated on each page ( 2 mark) - Width of the table shoeld fit within 1 page ( 2 mark) - Max, Min and Avg of each parancter (2 mark) - Clearly organized data (2 marks) Graphs (12 marks) - Chart title for each graph ( 3 marks) - Titie for each axis per graph (3 marks) - Legend for each graph (3 marks) - Plotted data for cach round of monitering results per graph (3 marks) Iaterpretation of Results (5 marks) - Compare the average parameter measuzements recorded to the recommended guideline level - Identify which, if any, parameters exceed the recommended guideline levels -If applicable, identify your recommendations The submitted assignment ( 6 marks) - Include a cover page: (2 marks)
Step by Step Solution
There are 3 Steps involved in it

Get step-by-step solutions from verified subject matter experts