

Question: Please give me a proper explanation and be correct please. Listed below are the numbers of years that archbishops and monarchs in a certain country
Please give me a proper explanation and be correct please.
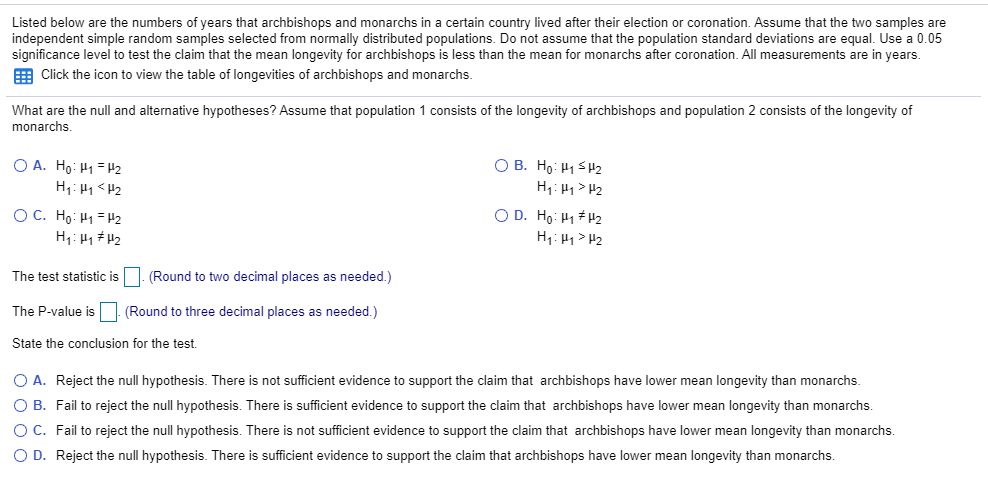
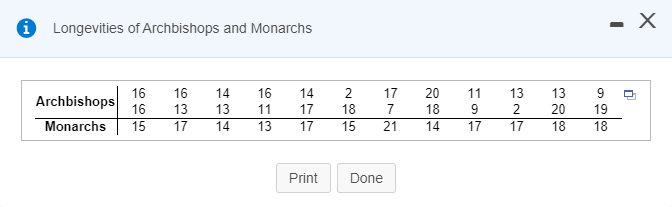
Listed below are the numbers of years that archbishops and monarchs in a certain country lived after their election or coronation. Assume that the two samples are independent simple random samples selected from normally distributed populations. Do not assume that the population standard deviations are equal. Use a 0.05 significance level to test the claim that the mean longevity for archbishops is less than the mean for monarchs after coronation. All measurements are in years. Click the icon to view the table of longevites of archbishops and monarchs. What are the null and alternative hypotheses? Assume that population 1 consists of the longevity of archbishops and population 2 consists of the longevity of monarchs. OA. Ho: H1 = H2 OB. Ho: H1 S H2 Hy : Hy
H2 O C. Ho: H1 = H2 OD. Ho: H1 # H2 Hy : My # H2 Hy : H1 > H2 The test statistic is (Round to two decimal places as needed.) The P-value is . (Round to three decimal places as needed.) State the conclusion for the test. O A. Reject the null hypothesis. There is not sufficient evidence to support the claim that archbishops have lower mean longevity than monarchs. O B. Fail to reject the null hypothesis. There is sufficient evidence to support the claim that archbishops have lower mean longevity than monarchs. O C. Fail to reject the null hypothesis. There is not sufficient evidence to support the claim that archbishops have lower mean longevity than monarchs. O D. Reject the null hypothesis. There is sufficient evidence to support the claim that archbishops have lower mean longevity than monarchs.\f
Step by Step Solution
There are 3 Steps involved in it

Get step-by-step solutions from verified subject matter experts