

Question: Please give me Answer fastly Statistics and Probability Coefficients Standard Error t Stat P-value Lower 9. Intercept 34.38278216 2.932853 11.72332 5.14E-23 28.58836 sex 1.618997232 0.581019
Please give me Answer fastly
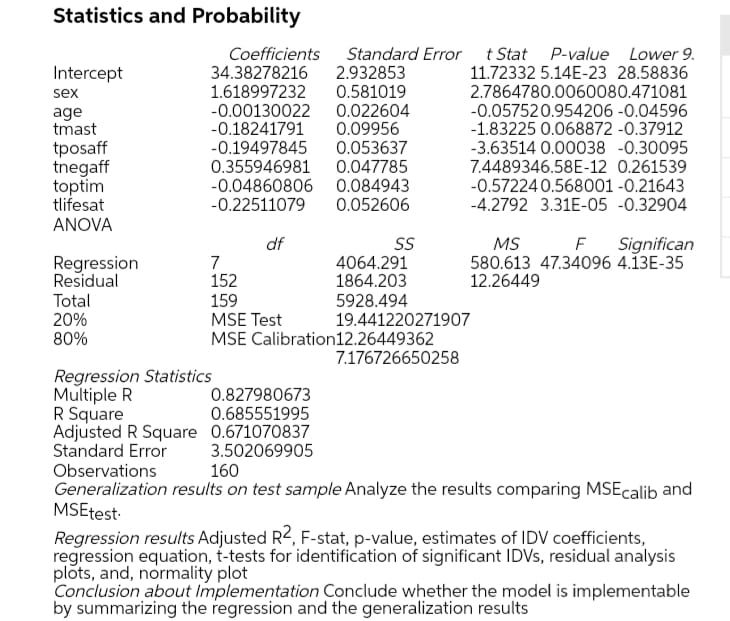
Statistics and Probability Coefficients Standard Error t Stat P-value Lower 9. Intercept 34.38278216 2.932853 11.72332 5.14E-23 28.58836 sex 1.618997232 0.581019 2.7864780.0060080.471081 age -0.00130022 0.022604 -0.057520.954206 -0.04596 tmast 0.18241791 0.09956 -1.83225 0.068872 -0.37912 tposaff 0.19497845 0.053637 -3.63514 0.00038 -0.30095 thegaff 0.355946981 0.047785 7.4489346.58E-12 0.261539 toptim -0.04860806 0.084943 -0.572240.568001 -0.21643 tlifesat -0.22511079 0.052606 -4.2792 3.31E-05 -0.32904 ANOVA df SS MS F Significan Regression 7 4064.291 580.613 47.34096 4.13E-35 Residual 152 1864.203 12.26449 Total 159 5928.494 20% MSE Test 19.441220271907 80% MSE Calibration12.26449362 7.176726650258 Regression Statistics Multiple R 0.827980673 R Square 0.685551995 Adjusted R Square 0.671070837 Standard Error 3.502069905 Observations 160 Generalization results on test sample Analyze the results comparing MSEcalib and MSEtest. Regression results Adjusted RZ, F-stat, p-value, estimates of IDV coefficients, regression equation, t-tests for identification of significant IDVs, residual analysis plots, and, normality plot Conclusion about Implementation Conclude whether the model is implementable by summarizing the regression and the generalization results
Step by Step Solution
There are 3 Steps involved in it

Get step-by-step solutions from verified subject matter experts