

Question: please give me explanation for the answer QUESTION 1 Q Home Insert Draw Design Layout References Mailings Review View Table Design Layout ? Tell me
please give me explanation for the answer
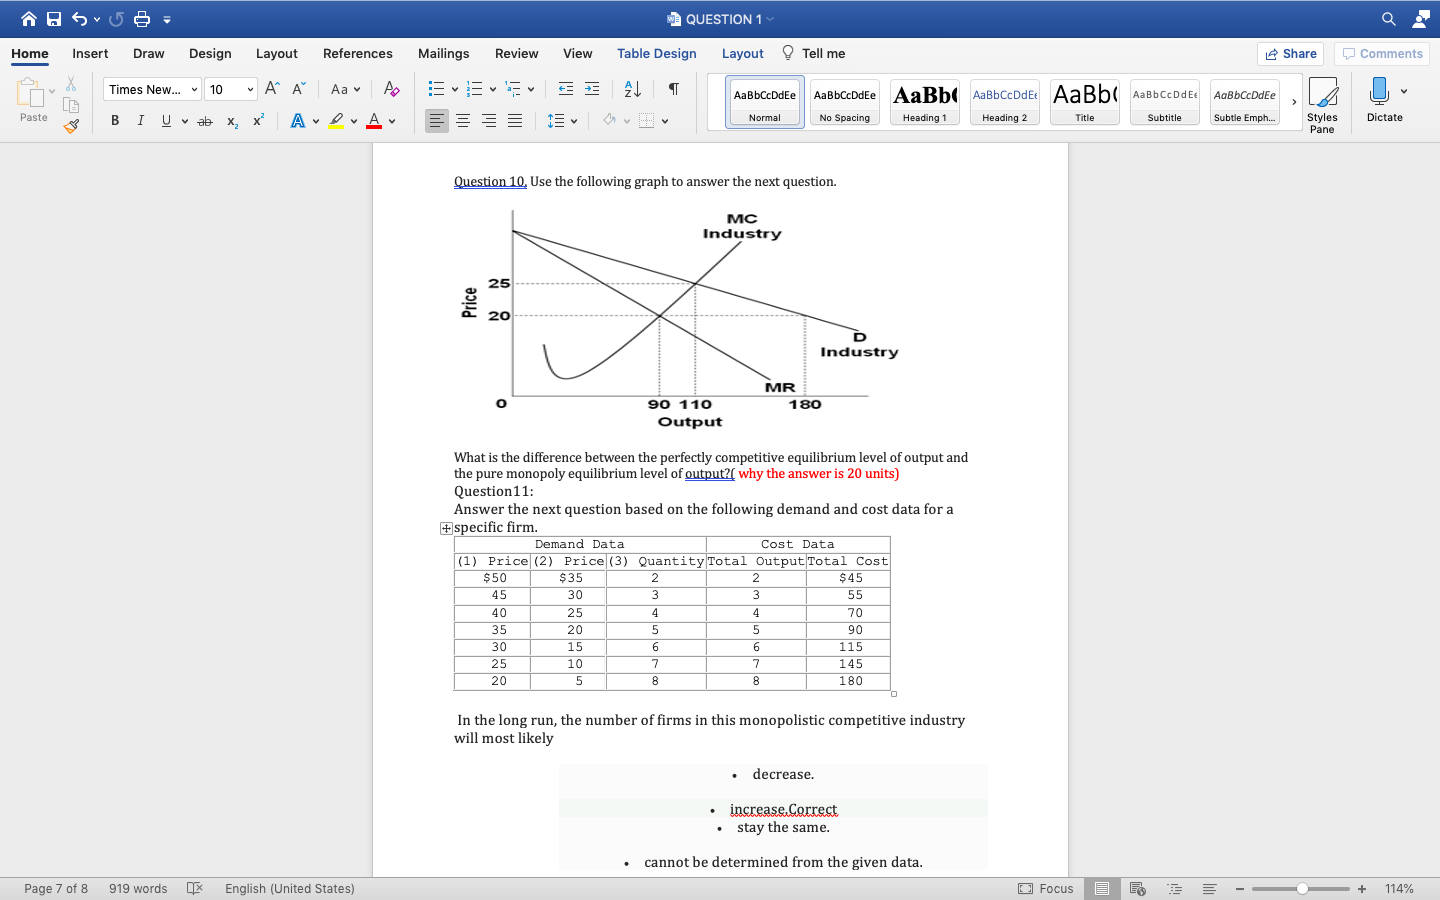
QUESTION 1 Q Home Insert Draw Design Layout References Mailings Review View Table Design Layout ? Tell me Share Comments Times New... ~ 10 A" A Aa Po 24 T AaBbCcDdEe AaBbCcDdEe AaBb( AaBbCcDdE AaBb( AaBbCcDdE AaBbCcDdEe Paste BI Uvab X x A LA Normal No Spacing Heading 1 Heading 2 Title Subtitle Subtle Emph Styles Dictate Pane Question 10, Use the following graph to answer the next question. MC Industry 25 - Price 20 Industry MR 90 110 180 Output What is the difference between the perfectly competitive equilibrium level of output and the pure monopoly equilibrium level of output?( why the answer is 20 units Question 11: Answer the next question based on the following demand and cost data for a + specific firm. Demand Data Cost Data (1) Price (2) Price (3) Quantity Total Output Total Cost $50 $35 2 2 $45 45 30 55 40 25 4 70 35 20 90 30 15 6 115 25 10 145 20 5 8 180 In the long run, the number of firms in this monopolistic competitive industry will most likely decrease. increase Correct stay the same. cannot be determined from the given data. Page 7 of 8 919 words [X English (United States) Focus E + 114%
Step by Step Solution
There are 3 Steps involved in it

Get step-by-step solutions from verified subject matter experts