

Question: please graph log log graph for first photo using this data and find slope and intercept and other compution from the graph. for second one
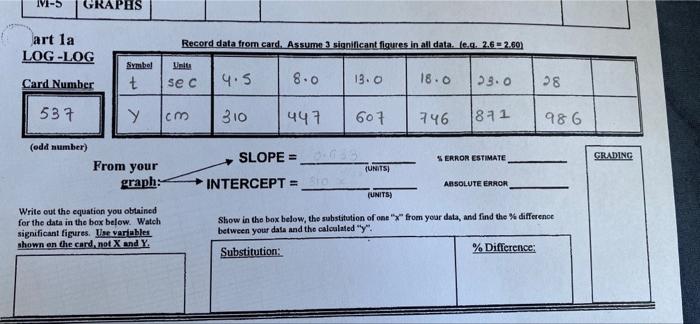
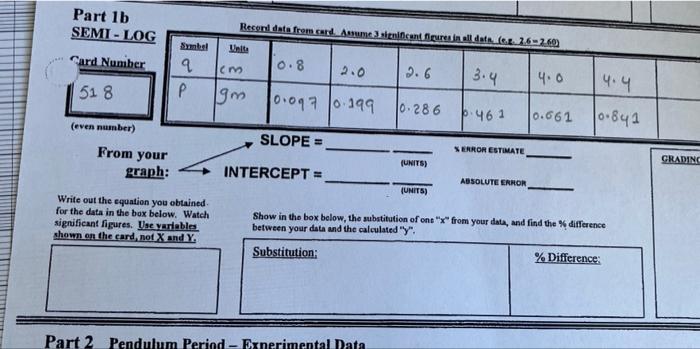
IVES art la LOG-LOG Record data from card. Assume a significant figures in all data. leg. 2.6 2.60) Untus Symbel t Card Number sec 4.5 8.0 13.0 18.0 23.0 38 & 537 Y cm 310 447 601 746 1871 986 (odd number) SLOPE = SERROR ESTIMATE GRADING From your graph: UNITS) INTERCEPT = ABSOLUTE ERROR (UNITS Write out the equation you obtained for the data in the box below. Watch significant figures. Ilse variables shown on the card, not X and Y Show in the box below, the substitution of one "x" from your data, and find the difference between your data and the calculated "y": Substitution: % Difference: Part 1b SEMI-LOG Card Number Recent data from card American Dresin all data (e. 26-260 Symbol q cm 0.8 2.0 2.6 3.4 4.0 P 9m 1o.oq7 1o. 199 1o. 286 6.461 0.661 4.4 518 10.841 (even number) SLOPE = SERROR ESTIMATE From your graph: (UNITS) GRADING INTERCEPT = ABSOLUTE ERROR (UNITS) Write out the equation you obtained for the data in the box below. Watch significant figures. Une variables shown on the card, not X and Y. Show in the box below, the substitution of one "x" from your data, and find the difference between your data and the calculated "y": Substitution: % Difference: Part 2 Pendulum Period - Experimental Data IVES art la LOG-LOG Record data from card. Assume a significant figures in all data. leg. 2.6 2.60) Untus Symbel t Card Number sec 4.5 8.0 13.0 18.0 23.0 38 & 537 Y cm 310 447 601 746 1871 986 (odd number) SLOPE = SERROR ESTIMATE GRADING From your graph: UNITS) INTERCEPT = ABSOLUTE ERROR (UNITS Write out the equation you obtained for the data in the box below. Watch significant figures. Ilse variables shown on the card, not X and Y Show in the box below, the substitution of one "x" from your data, and find the difference between your data and the calculated "y": Substitution: % Difference: Part 1b SEMI-LOG Card Number Recent data from card American Dresin all data (e. 26-260 Symbol q cm 0.8 2.0 2.6 3.4 4.0 P 9m 1o.oq7 1o. 199 1o. 286 6.461 0.661 4.4 518 10.841 (even number) SLOPE = SERROR ESTIMATE From your graph: (UNITS) GRADING INTERCEPT = ABSOLUTE ERROR (UNITS) Write out the equation you obtained for the data in the box below. Watch significant figures. Une variables shown on the card, not X and Y. Show in the box below, the substitution of one "x" from your data, and find the difference between your data and the calculated "y": Substitution: % Difference: Part 2 Pendulum Period - Experimental Data
Step by Step Solution
There are 3 Steps involved in it

Get step-by-step solutions from verified subject matter experts