

Question: Please graph the following ratios. You decide the visuals, but they need to be clear and easy to understand. Liqudity Ratios Current Ratio Quick Ratio
Please graph the following ratios. You decide the visuals, but they need to be clear and easy to understand.

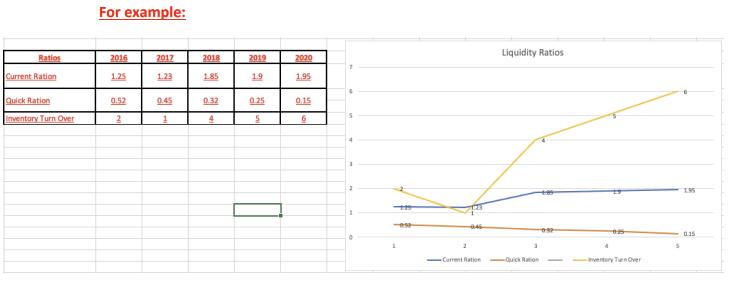
Liqudity Ratios Current Ratio Quick Ratio Cash Ratio 2017 1.59 0.56 0.11 2018 1.38 1.33 0.5 2019 0.78 1.08 0.21 2020 1.58 1.19 0.4 2021 1.51 1.44 0.52
Step by Step Solution
★★★★★
3.44 Rating (154 Votes )
There are 3 Steps involved in it
1 Expert Approved Answer
Step: 1 Unlock

2 W N 3 4 5 6 7 8 9 10 11 12 13 3 H 14 56 15 16 17 18 19 20 21 22 23 24 B LIQUIDIT... View full answer
Question Has Been Solved by an Expert!
Get step-by-step solutions from verified subject matter experts
Step: 2 Unlock
Step: 3 Unlock