

Question: Please graph the problems too! Diamond Name:_ cady . pathammavong Class Period: Date: Data Tables, Graphs and Drawing Conclusions A construction company gathers data for
Please graph the problems too!
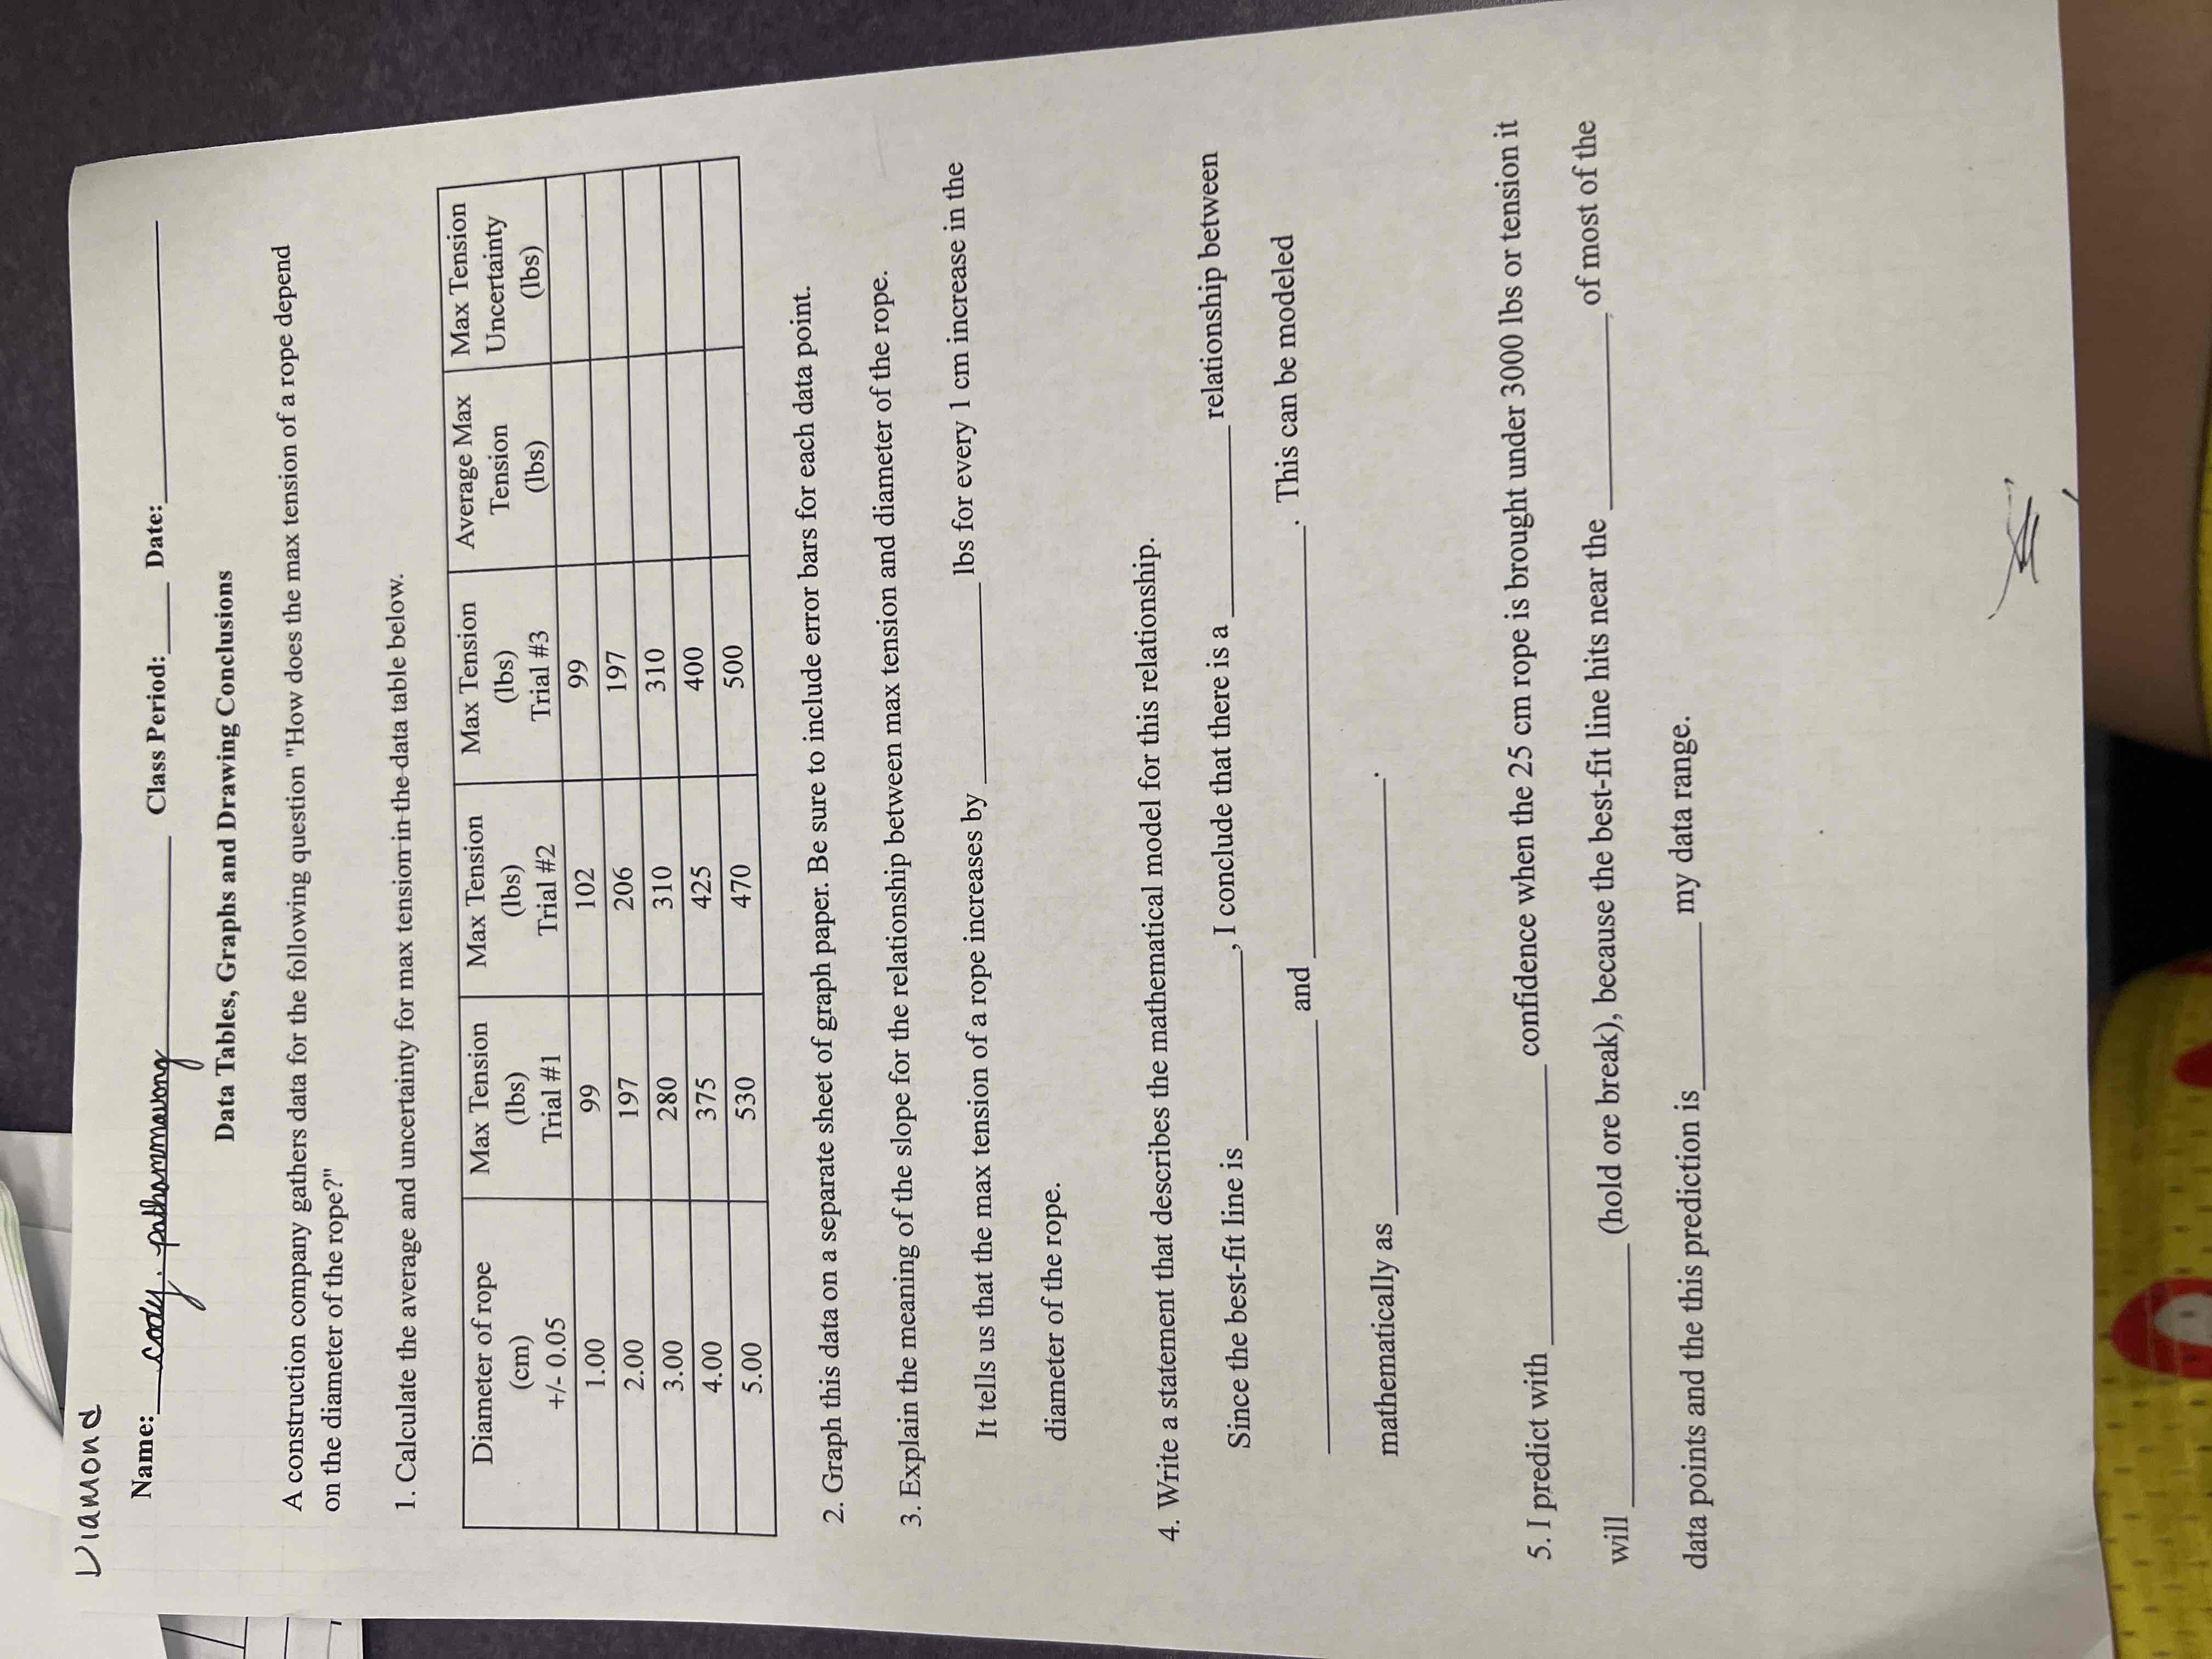
Diamond Name:_ cady . pathammavong Class Period: Date: Data Tables, Graphs and Drawing Conclusions A construction company gathers data for the following question "How does the max tension of a rope depend on the diameter of the rope?" 1. Calculate the average and uncertainty for max tension in the data table below. Diameter of rope Max Tension Max Tension Max Tension Average Max Max Tension (cm) (Ibs) (lbs) (Ibs) Tension Uncertainty +/- 0.05 Trial #1 Trial #2 Trial #3 (1bs) (Ibs) 1.0 9 102 99 2.00 197 206 197 3.00 280 310 310 4.00 375 125 400 5.00 530 470 500 2. Graph this data on a separate sheet of graph paper. Be sure to include error bars for each data point. 3. Explain the meaning of the slope for the relationship between max tension and diameter of the rope. It tells us that the max tension of a rope increases by lbs for every 1 cm increase in the diameter of the rope. 4. Write a statement that describes the mathematical model for this relationship. Since the best-fit line is I conclude that there is a relationship between and This can be modeled mathematically as 5. I predict with confidence when the 25 cm rope is brought under 3000 lbs or tension it will (hold ore break), because the best-fit line hits near the of most of the data points and the this prediction is my data range.\f
Step by Step Solution
There are 3 Steps involved in it

Get step-by-step solutions from verified subject matter experts