

Question: please Graph this. The graph us what they give us. They want us to add on it. A nasty fungus sharply reduces the supply of
please Graph this. The graph us what they give us. They want us to add on it. 
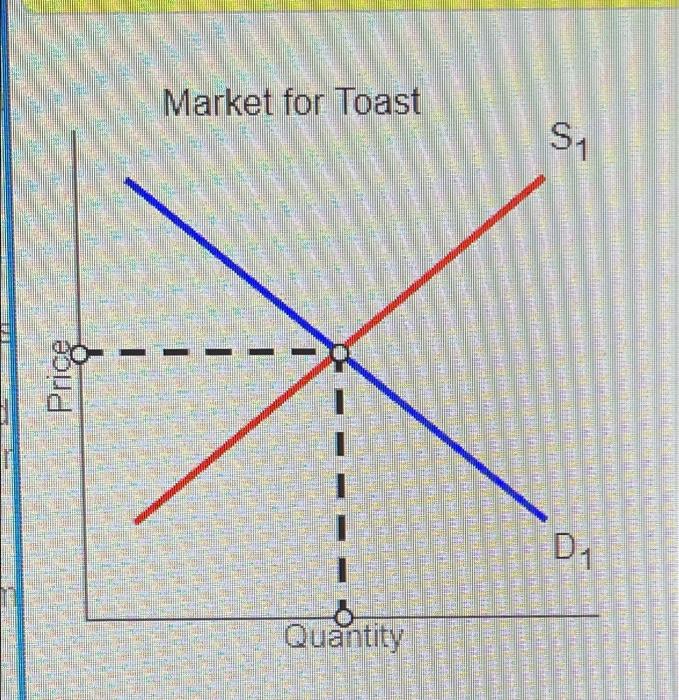
A nasty fungus sharply reduces the supply of flour for bread. What will happen to the equilibrium price and quantity of both toast and eggs as a result of this event? 1.) Using the line drawing tool, illustrate the impact of the reduced supply of flour for bread on the market for toast by either drawing a new supply or demand curve. Label the new curve either 'S2' or 'D2 2.) Using the point drawing tool, illustrate the new equilibrium in the toast market. Label this point 'A' Market for Toast S1 Price D. o Quantity TE GE
Step by Step Solution
There are 3 Steps involved in it
1 Expert Approved Answer
Step: 1 Unlock

Question Has Been Solved by an Expert!
Get step-by-step solutions from verified subject matter experts
Step: 2 Unlock
Step: 3 Unlock