

Question: Please Help 1 2 3 4 5 6 7 8 9 10 11 12 13 14 15 16 17 Data for the Last Three Years
Please Help
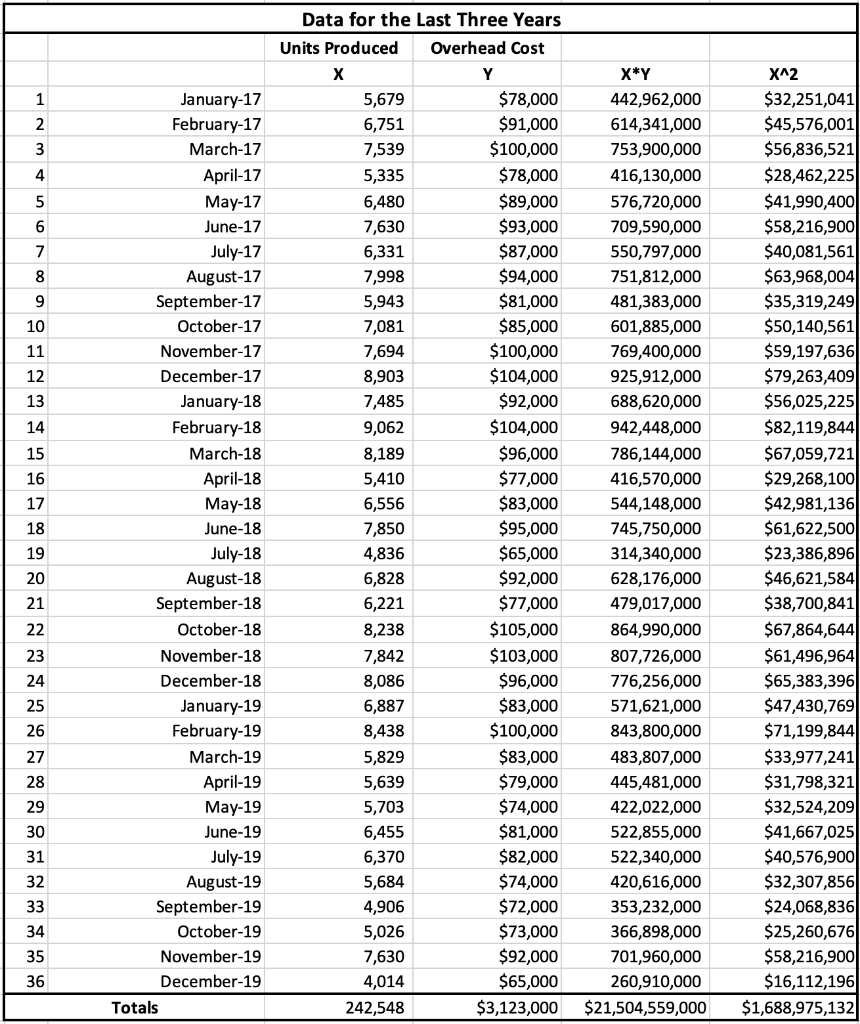
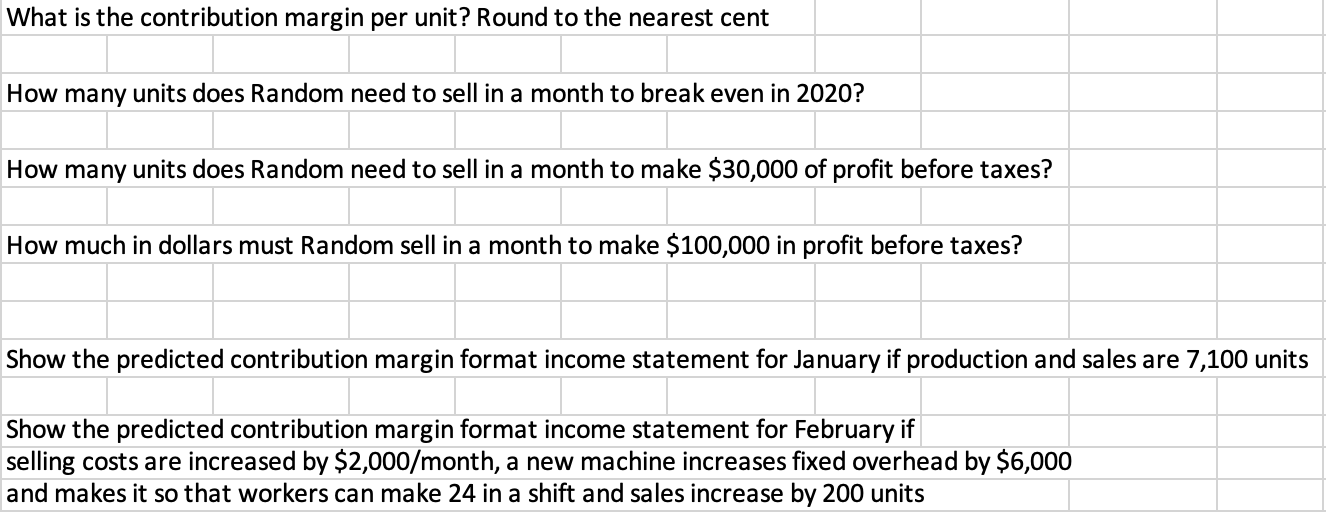
1 2 3 4 5 6 7 8 9 10 11 12 13 14 15 16 17 Data for the Last Three Years Units Produced Overhead Cost Y 5,679 $78,000 6,751 $91,000 7,539 $100,000 5,335 $78,000 6,480 $89,000 7,630 $93,000 6,331 $87,000 7,998 $94,000 5,943 $81,000 7,081 $85,000 7,694 $100,000 8,903 $104,000 7,485 $92,000 9,062 $104,000 8,189 $96,000 5,410 $77,000 6,556 $83,000 7,850 $95,000 4,836 $65,000 6,828 $92,000 6,221 $77,000 8,238 $105,000 7,842 $103,000 8,086 $96,000 6,887 $83,000 8,438 $100,000 $83,000 5,639 $79,000 5,703 $74,000 6,455 $81,000 6,370 $82,000 5,684 $74,000 4,906 $72,000 5,026 $73,000 7,630 $92,000 4,014 $65,000 242,548 $3,123,000 18 January-17 February-17 March-17 April-17 May-17 June-17 July-17 August-17 September-17 October-17 November-17 December-17 January-18 February-18 March-18 April-18 May-18 June-18 July-18 August-18 September-18 October-18 November-18 December-18 January-19 February-19 March-19 April-19 May-19 June-19 July-19 August-19 September-19 October-19 November-19 December-19 Totals X*Y 442,962,000 614,341,000 753,900,000 416,130,000 576,720,000 709,590,000 550,797,000 751,812,000 481,383,000 601,885,000 769,400,000 925,912,000 688,620,000 942,448,000 786,144,000 416,570,000 544,148,000 745,750,000 314,340,000 628,176,000 479,017,000 864,990,000 807,726,000 776,256,000 571,621,000 843,800,000 483,807,000 445,481,000 422,022,000 522,855,000 522,340,000 420,616,000 353,232,000 366,898,000 701,960,000 260,910,000 $21,504,559,000 X^2 $32,251,041 $45,576,001 $56,836,521 $28,462,225 $41,990,400 $58,216,900 $40,081,561 $63,968,004 $35,319,249 $50,140,561 $59,197,636 $79,263,409 $56,025,2251 $82,119,844 $67,059,721 $29,268,100 $42,981,136 $61,622,500) $23,386,896 $46,621,584 $38,700,841 $67,864,644 $61,496,964 $65,383,396 $47,430,769 $71,199,844 $33,977,241 $31,798,321 $32,524,209 $41,667,025 $40,576,900 $32,307,856 $24,068,836 $25,260,676 $58,216,900 $16,112,196 $1,688,975,132 19 20 21 22 23 24 25 26 27 5,829 28 29 30 31 32 33 34 35 36 What is the contribution margin per unit? Round to the nearest cent How many units does Random need to sell in a month to break even in 2020? How many units does Random need to sell in a month to make $30,000 of profit before taxes? How much in dollars must Random sell in a month to make $100,000 in profit before taxes? Show the predicted contribution margin format income statement for January if production and sales are 7,100 units Show the predicted contribution margin format income statement for February if selling costs are increased by $2,000/month, a new machine increases fixed overhead by $6,000 and makes it so that workers can make 24 in a shift and sales increase by 200 units a
Step by Step Solution
There are 3 Steps involved in it

Get step-by-step solutions from verified subject matter experts