

Question: Please help 1 FORD AND KELLOGG ON SAME GRAPH begin{tabular}{|c|c|} hline 2 & Date hline 3 & 1/Dec/95 hline 4 & 2/Dec/96
Please help
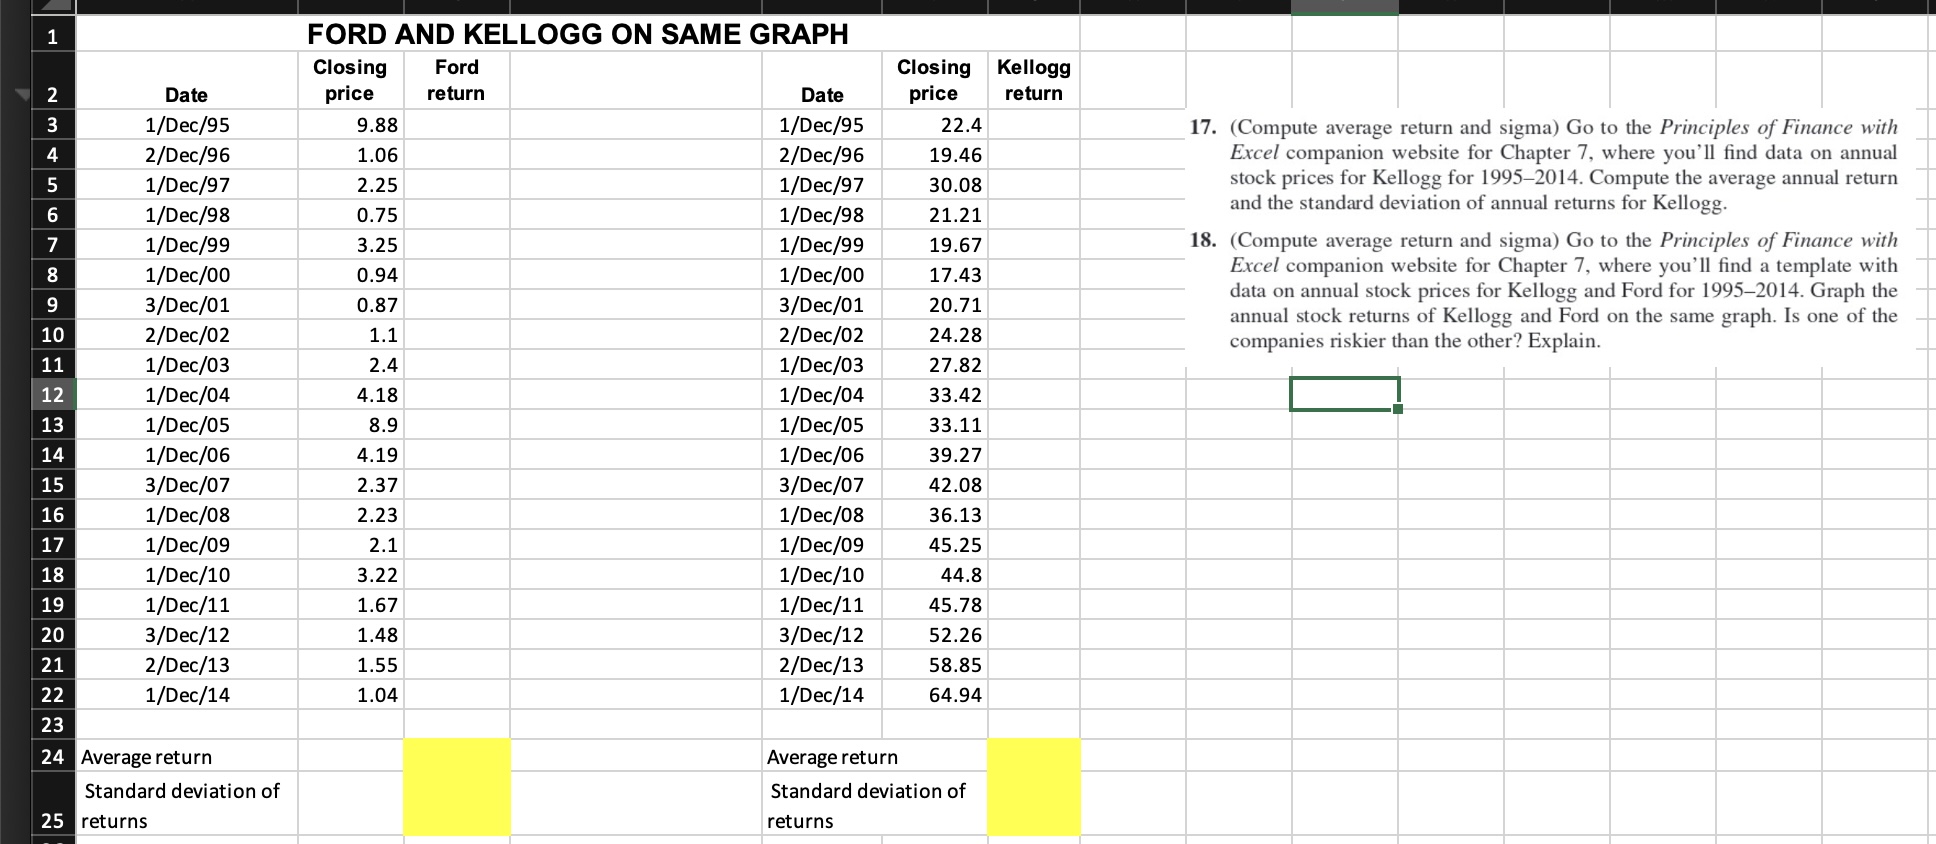
1 FORD AND KELLOGG ON SAME GRAPH \begin{tabular}{|c|c|} \hline 2 & Date \\ \hline 3 & 1/Dec/95 \\ \hline 4 & 2/Dec/96 \\ \hline 5 & 1/Dec/97 \\ \hline 6 & 1/Dec/98 \\ \hline 7 & 1/Dec/99 \\ \hline 8 & 1/Dec/00 \\ \hline 9 & 3/Dec/01 \\ \hline 10 & 2/Dec/02 \\ \hline 11 & 1/Dec/03 \\ \hline 12 & 1/Dec/04 \\ \hline 13 & 1/Dec/05 \\ \hline 14 & 1/Dec/06 \\ \hline 15 & 3/Dec/07 \\ \hline 16 & 1/Dec/08 \\ \hline 17 & 1/Dec/09 \\ \hline 18 & 1/Dec/10 \\ \hline 19 & 1/Dec/11 \\ \hline 20 & 3/Dec/12 \\ \hline 21 & 2/Dec/13 \\ \hline 22 & 1/Dec/14 \\ \hline 23 & \\ \hline 24 & Average return \\ \hline 25 & \begin{tabular}{l} Standard deviation of \\ returns \end{tabular} \\ \hline \end{tabular} \begin{tabular}{|c|c|c|c|} \hline \begin{tabular}{l} Closing \\ price \end{tabular} & \begin{tabular}{l} Ford \\ return \end{tabular} & Date & \begin{tabular}{l} Closing \\ price \end{tabular} \\ \hline 9.88 & & 1/Dec/95 & 22.4 \\ \hline 1.06 & & 2/Dec/96 & 19.46 \\ \hline 2.25 & & 1/Dec/97 & 30.08 \\ \hline 0.75 & & 1/Dec/98 & 21.21 \\ \hline 3.25 & & 1/Dec/99 & 19.67 \\ \hline 0.94 & & 1/Dec/00 & 17.43 \\ \hline 0.87 & & 3/Dec/01 & 20.71 \\ \hline 1.1 & & 2/Dec/02 & 24.28 \\ \hline 2.4 & & 1/Dec/03 & 27.82 \\ \hline 4.18 & & 1/Dec/04 & 33.42 \\ \hline 8.9 & & 1/Dec/05 & 33.11 \\ \hline 4.19 & & 1/Dec/06 & 39.27 \\ \hline 2.37 & & 3/Dec/07 & 42.08 \\ \hline 2.23 & & 1/Dec/08 & 36.13 \\ \hline 2.1 & & 1/Dec/09 & 45.25 \\ \hline 3.22 & & 1/Dec/10 & 44.8 \\ \hline 1.67 & & 1/Dec/11 & 45.78 \\ \hline 1.48 & & 3/Dec/12 & 52.26 \\ \hline 1.55 & & 2/Dec/13 & 58.85 \\ \hline 1.04 & & 1/Dec/14 & 64.94 \\ \hline & & & \\ \hline & & \multicolumn{2}{|c|}{ Average return } \\ \hline & & \multicolumn{2}{|c|}{\begin{tabular}{l} Standard deviation of \\ returns \end{tabular}} \\ \hline \end{tabular} 17. (Compute average return and sigma) Go to the Principles of Finance with Excel companion website for Chapter 7, where you'll find data on annual stock prices for Kellogg for 1995-2014. Compute the average annual return and the standard deviation of annual returns for Kellogg. 18. (Compute average return and sigma) Go to the Principles of Finance with Excel companion website for Chapter 7, where you'll find a template with data on annual stock prices for Kellogg and Ford for 1995-2014. Graph the annual stock returns of Kellogg and Ford on the same graph. Is one of the companies riskier than the other? Explain
Step by Step Solution
There are 3 Steps involved in it

Get step-by-step solutions from verified subject matter experts